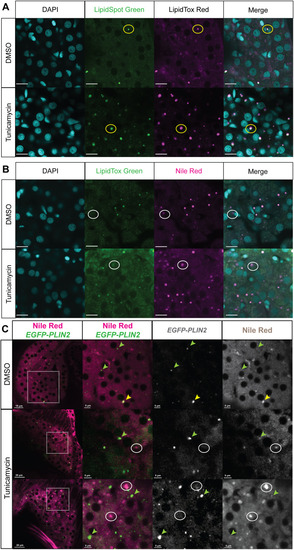
Comparing NR to LipidTox, LipidSpot and EGFP-PLIN2 labelling of LDs in hepatocytes. Larvae were treated with DMSO or 0.5 μg/ml TM, fixed and processed as described for fluorescent confocal microscopy to detect LDs. (A) Representative confocal images of hepatocyte nuclei (blue-DAPI) and LDs (green and magenta) co-labelled with LipidSpot and LipidTox. The 128 hpf zebrafish larvae were treated with DMSO or 0.5 μg/ml TM from 96 to 128 hpf. Scale bars: 10 μm. The yellow circles highlight an LD that is present in all images. (B) Representative confocal images of hepatocyte nuclei (blue-DAPI) and LDs (green and magenta) co-labelled with LipidTox and NR. The 128 hpf zebrafish larvae were treated with DMSO or 0.5 μg/ml TM from 96 to 128 hpf. Scale bars: 10 μm. The white circles highlight an LD that is detected by NR but not by LipidTox Green. (C) Tg(fabp10a:EGFP-PLIN2) larvae were treated with 0.5 µg/ml TM from 96 to 120 hpf and stained with NR for live confocal imaging. Samples were assessed for LDs labelled with NR, EGFP or both. Green arrowheads point to LDs that are detected with EGFP but not NR, white circles highlight LDs detected with NR but not EGFP, and yellow arrowheads indicated an LD that is detected with both EGFP and NR. Scale bars: 5, 15 and 20 µm as indicated on each image individually. The images were taken from a single z-plane and represent more than 20 larvae imaged from more than two clutches.
|
