FIGURE SUMMARY
Title

Optimised methods to image hepatic lipid droplets in zebrafish larvae

Authors
Khan, N., Salmi, T.M., Karamalakis, A.P., Nair, A.R., Sadler, K.C., Cox, A.G.
Source
Full text @ Dis. Model. Mech.

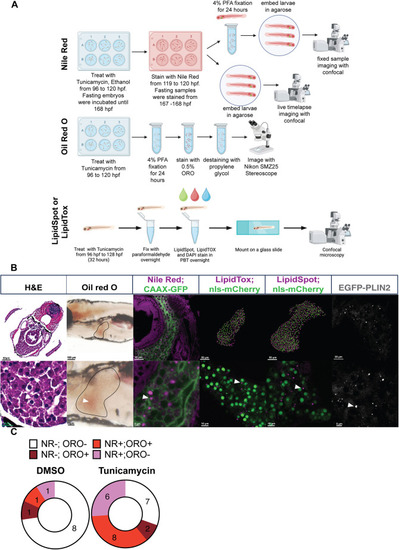
Toolbox to assess hepatic lipid droplets (LDs) in zebrafish larvae. (A) Treatment protocol for inducing steatosis in zebrafish embryos with either tunicamycin (TM) or fasting to 168 h post fertilization (hpf) [7 days post fertilization (dpf)] to assess the use of Oil Red O (ORO), Nile Red (NR), LipidTox and LipidSpot to detect LDs. DAPI, 4′,6-diamidino-2-phenylindole; PBT, phosphate buffered saline containing Tween 20; PFA, paraformaldehyde. (B) Comparison of methods used to detect LD accumulation in the liver of 5 dpf larvae following treatment with TM. Histological [Haematoxylin and Eosin (H&E)] assessment of steatosis compared to dye-based evaluation of LD staining as outlined in A. Staining with ORO, NR, LipidSpot, LipidTox and the transgenic line Tg(fabp10a:EGFP-PLIN2) shows LDs in hepatocytes as viewed by light stereomicroscopy (ORO), multiphoton microscopy (LipidTox and LipidSpot, Imaris rendering of 3D-confocal z-stacks) or confocal microscopy (NR and EGFP-PLIN2, single z-section). LipidTox and LipidSpot samples were imaged along with a transgenic marker for the nucleus Tg(fabp10a:NLS-mCherry), and the NR images were obtained in larvae with EGFP targeted to the hepatocyte cell membrane [Tg(fabp10a:CAAX-EGFP)]. Scale bars: 5, 10, 20, 50 and 100 µm as indicated on each image individually. The images show a typical liver with LD accumulation detected by each staining method as viewed from over 100 embryos from over 20 clutches per staining method. (C) NR is more sensitive than ORO at detecting LD presence in hepatocytes. Larvae were treated with 0.5 µg/ml TM or dimethyl sulfoxide (DMSO) from 96 to 120 hpf, collected and stained with NR, imaged using confocal microscopy, scored as negative or positive for steatosis, then recovered as individual larvae and processed for ORO staining, and scored as negative or positive for steatosis based on the presence of ORO-labelled LDs. Each larva was categorized based on the steatosis score for both dyes. The experiment was carried out on a total of 34 larvae from two clutches.

NR staining of LDs in live and fixed larvae shows increased steatosis incidence and severity in response to TM, ethanol and fasting. (A) Representative confocal images of hepatocytes (EGFP membrane marker; green) and LDs (magenta) in 120 hpf zebrafish untreated or treated with DMSO (vehicle), 350 mM ethanol (EtOH), 0.5 μg/ml TM from 96 to 120 hpf, and fasted larvae (7 dpf) stained with NR. The transgenic line Tg(fabp10a:CAAX-EGFP) was used to mark hepatocyte membrane. Scale bars: 20 μm. White arrowheads (LD) point to examples of LDs and yellow arrows (BV) point to blood vessels. Images are representative of 30 larvae from three clutches. (B) Steatosis incidence measured by percentage of samples having two or more LDs in a single z-plane through the middle of the liver (ns, not significant; *P<0.05, ***P<0.001, ****P<0.0001 by unpaired two-tailed Student's t-test, n=3 clutches, 30 larvae). (C) Steatosis severity quantified by the number of LDs divided by the total area of the liver in a single z-plane for each treatment condition (ns, non-significant; *P<0.05, **P<0.01, ***P<0.001, ****P<0.0001 by unpaired two-tailed Student's t-test, n=3 clutches, 30 larvae).

Hepatocyte LD dynamics can be imaged with NR in live zebrafish. (A) Schematic of short-term and long-term imaging treatment scheme using NR with TM exposure. (B) Representative stills from short-term and long-term movies of LDs in CAAX-GFP-marked larvae with NR staining at 120 hpf during TM exposure from 96 to 120 hpf. White arrowheads (LD) point to examples of LDs. Scale bars: 25 µm. The images were taken from a single z-section and are representative of more than six larvae from two clutches.

Comparing NR to LipidTox, LipidSpot and EGFP-PLIN2 labelling of LDs in hepatocytes. Larvae were treated with DMSO or 0.5 μg/ml TM, fixed and processed as described for fluorescent confocal microscopy to detect LDs. (A) Representative confocal images of hepatocyte nuclei (blue-DAPI) and LDs (green and magenta) co-labelled with LipidSpot and LipidTox. The 128 hpf zebrafish larvae were treated with DMSO or 0.5 μg/ml TM from 96 to 128 hpf. Scale bars: 10 μm. The yellow circles highlight an LD that is present in all images. (B) Representative confocal images of hepatocyte nuclei (blue-DAPI) and LDs (green and magenta) co-labelled with LipidTox and NR. The 128 hpf zebrafish larvae were treated with DMSO or 0.5 μg/ml TM from 96 to 128 hpf. Scale bars: 10 μm. The white circles highlight an LD that is detected by NR but not by LipidTox Green. (C) Tg(fabp10a:EGFP-PLIN2) larvae were treated with 0.5 µg/ml TM from 96 to 120 hpf and stained with NR for live confocal imaging. Samples were assessed for LDs labelled with NR, EGFP or both. Green arrowheads point to LDs that are detected with EGFP but not NR, white circles highlight LDs detected with NR but not EGFP, and yellow arrowheads indicated an LD that is detected with both EGFP and NR. Scale bars: 5, 15 and 20 µm as indicated on each image individually. The images were taken from a single z-plane and represent more than 20 larvae imaged from more than two clutches.

Quantitative hepatic LD analysis using LipidTox, LipidSpot and NR. (A) Representative Imaris-rendered confocal images of hepatocyte nuclei (green) and LDs (magenta) in zebrafish larvae treated with DMSO or 0.5 μg/ml TM from 96 to 128 hpf and stained with LipidSpot, LipidTox or NR. Transgenic lines to label hepatocyte nuclei were used in contrasting colours [i.e. Tg(fabp10a:NLS-mCherrry) and Tg(fabp10a:mGL-H2B)]. Scale bars: 50 μm. (B) Single confocal sections of fixed Tg(fabp10a:EGFP-PLIN2) larvae treated from 96 to 120 hpf with DMSO or TM, or maintained until 168 hpf as fasted samples, stained with NR. Scale bars: 20 μm. (C) Quantification of LD number and diameter in hepatocytes of zebrafish larvae stained with LipidSpot, LipidTox and NR as shown in A. Hepatic LDs for each larvae were detected to a depth of 100 μm (34 z-slices). Each datapoint represents a larva, and data are shown as median and interquartile range or mean and s.e.m. n>3. ns, not significant; **P<0.01, ****P<0.0001. Statistical analysis for LD number and size with two treatment groups was determined by unpaired two-tailed Student's t-test. (D) Quantification of LD number and diameter in hepatocytes of transgenic EGFP-PLIN2 zebrafish larvae as shown in B. Hepatic LDs were detected in a single z-plane in the left lobe of each larvae. Each datapoint represents a larva, and data are shown as median and interquartile range. n>4. *P<0.05, **P<0.01. Statistical analysis for LD number and size with two treatment groups was determined by unpaired two-tailed Student's t-test.

Acknowledgments
This image is the copyrighted work of the attributed author or publisher, and ZFIN has permission only to display this image to its users. Additional permissions should be obtained from the applicable author or publisher of the image. Full text @ Dis. Model. Mech.