IMAGE

Fig. 5.

ID
ZDB-IMAGE-241210-23
Source
Figures for Khan et al., 2024
Image
Figure Caption

Fig. 5.

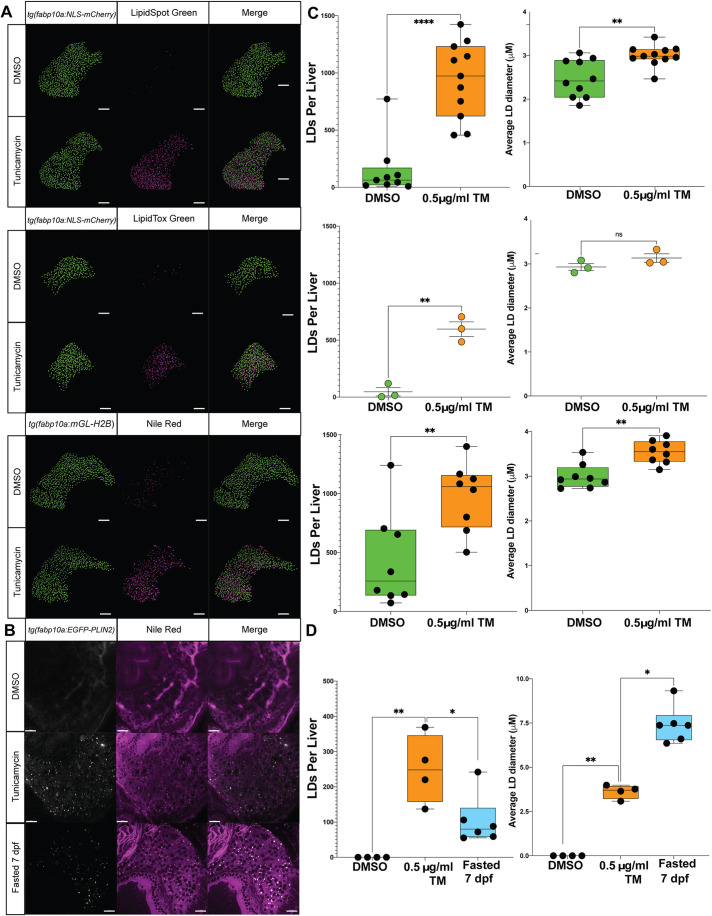
Quantitative hepatic LD analysis using LipidTox, LipidSpot and NR. (A) Representative Imaris-rendered confocal images of hepatocyte nuclei (green) and LDs (magenta) in zebrafish larvae treated with DMSO or 0.5 μg/ml TM from 96 to 128 hpf and stained with LipidSpot, LipidTox or NR. Transgenic lines to label hepatocyte nuclei were used in contrasting colours [i.e. Tg(fabp10a:NLS-mCherrry) and Tg(fabp10a:mGL-H2B)]. Scale bars: 50 μm. (B) Single confocal sections of fixed Tg(fabp10a:EGFP-PLIN2) larvae treated from 96 to 120 hpf with DMSO or TM, or maintained until 168 hpf as fasted samples, stained with NR. Scale bars: 20 μm. (C) Quantification of LD number and diameter in hepatocytes of zebrafish larvae stained with LipidSpot, LipidTox and NR as shown in A. Hepatic LDs for each larvae were detected to a depth of 100 μm (34 z-slices). Each datapoint represents a larva, and data are shown as median and interquartile range or mean and s.e.m. n>3. ns, not significant; **P<0.01, ****P<0.0001. Statistical analysis for LD number and size with two treatment groups was determined by unpaired two-tailed Student's t-test. (D) Quantification of LD number and diameter in hepatocytes of transgenic EGFP-PLIN2 zebrafish larvae as shown in B. Hepatic LDs were detected in a single z-plane in the left lobe of each larvae. Each datapoint represents a larva, and data are shown as median and interquartile range. n>4. *P<0.05, **P<0.01. Statistical analysis for LD number and size with two treatment groups was determined by unpaired two-tailed Student's t-test.

Acknowledgments
This image is the copyrighted work of the attributed author or publisher, and ZFIN has permission only to display this image to its users. Additional permissions should be obtained from the applicable author or publisher of the image. Full text @ Dis. Model. Mech.