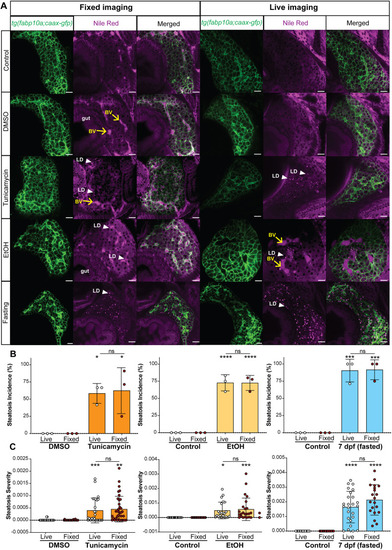
NR staining of LDs in live and fixed larvae shows increased steatosis incidence and severity in response to TM, ethanol and fasting. (A) Representative confocal images of hepatocytes (EGFP membrane marker; green) and LDs (magenta) in 120 hpf zebrafish untreated or treated with DMSO (vehicle), 350 mM ethanol (EtOH), 0.5 μg/ml TM from 96 to 120 hpf, and fasted larvae (7 dpf) stained with NR. The transgenic line Tg(fabp10a:CAAX-EGFP) was used to mark hepatocyte membrane. Scale bars: 20 μm. White arrowheads (LD) point to examples of LDs and yellow arrows (BV) point to blood vessels. Images are representative of 30 larvae from three clutches. (B) Steatosis incidence measured by percentage of samples having two or more LDs in a single z-plane through the middle of the liver (ns, not significant; *P<0.05, ***P<0.001, ****P<0.0001 by unpaired two-tailed Student's t-test, n=3 clutches, 30 larvae). (C) Steatosis severity quantified by the number of LDs divided by the total area of the liver in a single z-plane for each treatment condition (ns, non-significant; *P<0.05, **P<0.01, ***P<0.001, ****P<0.0001 by unpaired two-tailed Student's t-test, n=3 clutches, 30 larvae).
|
