
Fig. 1
- ID
- ZDB-FIG-241105-27
- Publication
- Ceci et al., 2024 - RACK1 contributes to the upregulation of embryonic genes in a model of cardiac hypertrophy
- Other Figures
- All Figure Page
- Back to All Figure Page
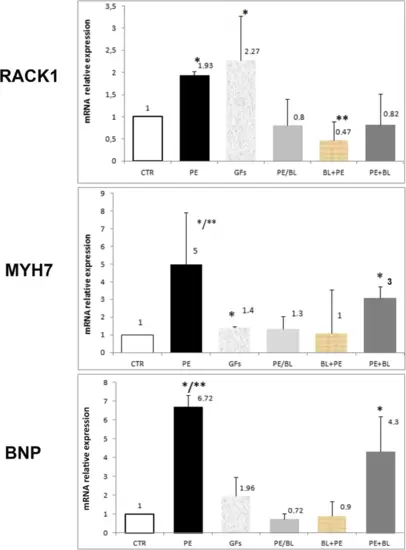
Quantitative RT‒PCR analysis of RACK1 and hypertrophy markers. The graph shows the relative expression of Rack1 (RACK1), myosin heavy chain 7 (MYH7), and brain natriuretic peptide (BNP). In the PE-treated samples, a significant increase in markers was observed compared with those in the control samples (PE vs. CTR; PE vs. all groups p < 0.001,*). The GFs group, despite the variability of the samples, was significantly greater than the CTR and the other groups were, except for the PE group (GFs vs. CTR, PE/BL, PE + BL BL + PE, *, p < 0.01). The PE/BL and PE + BL groups presented nonsignificant modifications, whereas the BL + PE group presented a reduction (BL + PE vs. CTR, **, p < 0,05). MYH7 expression was significantly upregulated in the PE and PE + BL groups (PE vs. CTR, *, PE vs. all groups, **, p < 0.001; PE + BL vs. all groups without PE, *, p < 0.005). Compared with the CTR group, the GFs group presented a slight increase (GFs vs. CTR, *, p < 0.05). BNP was increased in the PE group (PE vs. CTR; p < 0.001; *; PE vs. all other groups). **, p < 0.05) and the PE + BL group (PE + BL vs. CTR, *; p < 0.01). Conversely, this upregulation was partially repressed after pre- and cotreatment with BL. The GFs also presented a greater mean than did the control, but the variability among the samples was not statistically significant. Hearts from the fish in each group (n = 6) were subjected to triplicate experiments—statistical analysis: ANOVA with the Bonferroni correction. |