
Fig. 2
- ID
- ZDB-FIG-241105-28
- Publication
- Ceci et al., 2024 - RACK1 contributes to the upregulation of embryonic genes in a model of cardiac hypertrophy
- Other Figures
- All Figure Page
- Back to All Figure Page
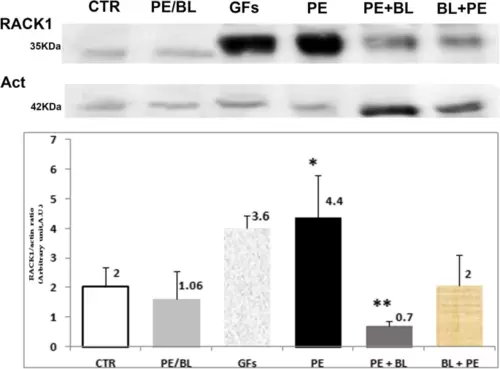
Immunoblot analysis of RACK1 protein expression in the experimental groups vs. CTR. Immunoblot images of Rack1 protein (RACK1) expression (upper part) and nonsarcomere actin (below) were used as housekeeping proteins. The graph shows the means of at least three independent experiments of the density ratio between the RACK1 and actin bands (mean ± S.D.). Compared with that in the CTR group, RAC1 expression was strongly marked in the PE group (p < 0,001, *), but appreciable positivity was also observed in the GFs in the CTR group (P < 0,05, *). The level of RACK1 was comparable to that of CTR in the other treatment groups. The PE + BL group expressed less protein than the CTR group did (**; p < 0.05). Hearts from the fish used in triplicate experiments (n = 10 in each group) were subjected to statistical analysis: ANOVA with the Bonferroni correction. |