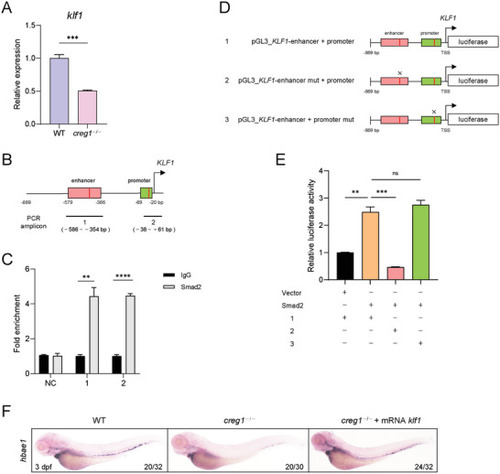
klf1, a downstream target gene of the Smad2 signaling pathway, is essential for creg1 deficiency‐induced aberrant erythropoiesis. A) Quantitative PCR analysis of klf1 expression between WT siblings and creg1−/− mutants at 3 dpf (n = 30 embryos per group). B) Schematic diagram of the cis‐regulatory elements of the human KLF1 locus. Red lines represent positions of potential Smad2 binding motifs. Numbered black lines indicate the position of the amplicons used for PCR quantification of the ChIP signal. C) ChIP‐qPCR analysis using antibodies against IgG or Smad2 was performed in K562 cells. Non‐target region is included as negative control (NC) for specificity of Smad2 enrichment. Data are representative of three independent experiments. D) The structure of recombined firefly luciferase expression vector driven by the KLF1 cis‐regulatory elements with normal or mutated Smad2 binding site. E) Luciferase activity assay in 293T cells transfected with Smad2 and distinct reporter constructs. The Renilla plasmid was used as an internal control. Data are representative of three independent experiments. F) WISH assay of hbae1 at 3 dpf. Data shown are the means ± SEM. Statistical significance was calculated using the Student's t‐test. **, p < 0.01; ***, p < 0.001; ****, p < 0.0001; ns, not significant.
|
