FIGURE SUMMARY
Title

Creg1 Regulates Erythroid Development via TGF-β/Smad2-Klf1 Axis in Zebrafish

Authors
Han, X., He, W., Liang, D., Liu, X., Zhou, J., de Thé, H., Zhu, J., Yuan, H.
Source
Full text @ Adv Sci (Weinh)

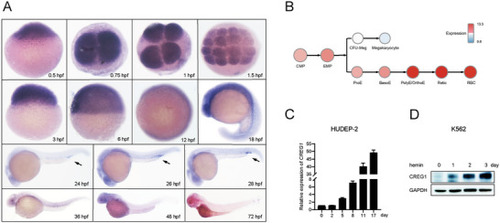
The expression profile of
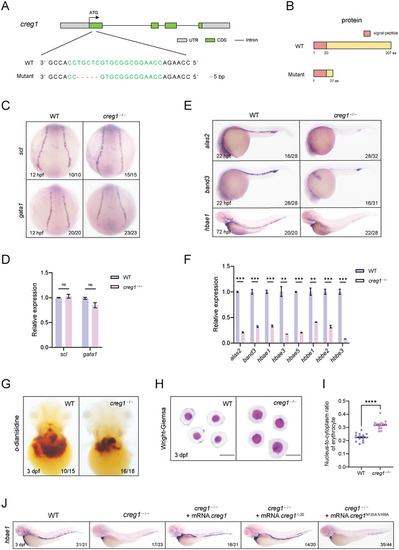
 creg1. A) WISH assay of creg1 during early zebrafish embryonic development. The arrows indicate the ICM/PBI region. B) CREG1 mRNA expression in normal human hematopoietic cells was analyzed using BloodSpot database. CMP, Common myeloid progenitor; EMP, Megakaryocyte/erythroid progenitor; ProE, proerythroblasts; BasoE, basophilic erythroblasts; PolyE/OrthoE, polychromatophilic/orthochromatophilic erythroblasts; Retic, reticulocyte; RBC, red blood cell; CFU‐Meg, Colony Forming Unit‐Megakaryocytic. C) Quantitative PCR analysis of CREG1 expression during erythroid differentiation of HUDEP‐2 cells. Data shown are the means ± SEM from three independent experiments. D) Western blot analysis of CREG1 in hemin‐treated K562 cells.

creg1 deficiency leads to defective erythroid differentiation and maturation. A) Genetic inactivation of the zebrafish creg1 gene based on CRISPR/Cas9. Schematic representation of CRISPR/Cas9 target site at exon 1 as used in this study. The gRNA target site is highlighted in green, and the indel is indicated by a red dash. B) Schematic representation of the WT and mutant Creg1 proteins. C) WISH assay of scl or gata1 at 12 hpf in WT siblings and creg1−/− mutants. D) Quantitative PCR analysis of scl or gata1 expression at 12 hpf in WT siblings and creg1−/− mutants (n=30 embryos per group). E) WISH assay of alas2, band3 or hbae1 at 22 or 72 hpf in WT siblings and creg1−/− mutants, respectively. F) Quantitative PCR analysis of alas2, band3 or globins expression at 72 hpf in WT siblings and creg1−/− mutants (n=30 embryos per group). G) o‐dianisidine staining in WT siblings and creg1−/− mutants at 3 dpf. H) Wright‐Giemsa staining of erythrocytes from WT siblings and creg1−/− mutants at 3 dpf. I) Nucleo‐cytoplasmic ratio analysis of erythrocytes from WT siblings and creg1−/− mutants at 3 dpf (n = 15 cells per group). J) WISH assay of hbae1 at 3 dpf for embryos injected with mRNA encoding distinct creg1 mutants. Data shown are the means ± SEM. Statistical significance was calculated using the Student's t‐test. **, p < 0.01; ***, p < 0.001; ****, p < 0.0001; ns, not significant.

Loss of creg1 results in elevated apoptosis of erythroid cells. A) Cell cycle analysis of gata1:dsRed+ erythroid cells from WT siblings (left) and creg1−/− mutants (right) at 2 dpf. Erythroid cell DNA content was measured by flow cytometry via Hoechst 33342 fluorescence intensity. B) Quantification of the percentage of cells in each cell cycle phase from (A) (n=100 embryos per group). C) FACS analyses of apoptotic cell death were performed with gata1:dsRed+ erythroid cells from WT siblings (left) and creg1−/− mutants (right) at 2 dpf using Annexin V/DAPI staining. D) Quantification of the percentage of gata1:dsRed+ erythroid cells that are Annexin V‐positive from (C) (n = 100 embryos per group). E) Quantitative PCR analysis of bida and baxa expression in gata1:dsRed+ erythroid cells from WT siblings and creg1−/− mutants at 2 dpf (n = 30 embryos per group). Data shown are the means ± SEM. Statistical significance was calculated using the Student's t‐test. *, p < 0.05; **, p < 0.01; ****, p < 0.0001; ns, not significant.

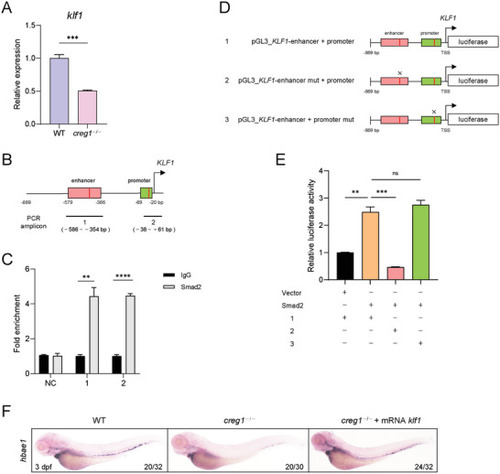
TGF‐β/Smad2 signaling pathway is implicated in creg1‐mediated erythroid development. A) Western blot analysis of gata1:dsRed+ erythroid cells from WT siblings and creg1−/− mutants at 3 dpf. B) WISH assay of hbae1 at 2 dpf for embryos treated for 36 h with DMSO or IDE2. C–E) Western blot analysis of TGF‐β/Smad2 signaling‐related proteins in K562 cells.

klf1, a downstream target gene of the Smad2 signaling pathway, is essential for creg1 deficiency‐induced aberrant erythropoiesis. A) Quantitative PCR analysis of klf1 expression between WT siblings and creg1−/− mutants at 3 dpf (n = 30 embryos per group). B) Schematic diagram of the cis‐regulatory elements of the human KLF1 locus. Red lines represent positions of potential Smad2 binding motifs. Numbered black lines indicate the position of the amplicons used for PCR quantification of the ChIP signal. C) ChIP‐qPCR analysis using antibodies against IgG or Smad2 was performed in K562 cells. Non‐target region is included as negative control (NC) for specificity of Smad2 enrichment. Data are representative of three independent experiments. D) The structure of recombined firefly luciferase expression vector driven by the KLF1 cis‐regulatory elements with normal or mutated Smad2 binding site. E) Luciferase activity assay in 293T cells transfected with Smad2 and distinct reporter constructs. The Renilla plasmid was used as an internal control. Data are representative of three independent experiments. F) WISH assay of hbae1 at 3 dpf. Data shown are the means ± SEM. Statistical significance was calculated using the Student's t‐test. **, p < 0.01; ***, p < 0.001; ****, p < 0.0001; ns, not significant.

Acknowledgments
This image is the copyrighted work of the attributed author or publisher, and ZFIN has permission only to display this image to its users. Additional permissions should be obtained from the applicable author or publisher of the image. Full text @ Adv Sci (Weinh)