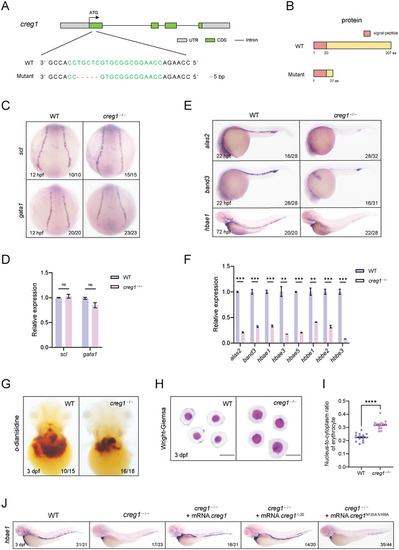
creg1 deficiency leads to defective erythroid differentiation and maturation. A) Genetic inactivation of the zebrafish creg1 gene based on CRISPR/Cas9. Schematic representation of CRISPR/Cas9 target site at exon 1 as used in this study. The gRNA target site is highlighted in green, and the indel is indicated by a red dash. B) Schematic representation of the WT and mutant Creg1 proteins. C) WISH assay of scl or gata1 at 12 hpf in WT siblings and creg1−/− mutants. D) Quantitative PCR analysis of scl or gata1 expression at 12 hpf in WT siblings and creg1−/− mutants (n=30 embryos per group). E) WISH assay of alas2, band3 or hbae1 at 22 or 72 hpf in WT siblings and creg1−/− mutants, respectively. F) Quantitative PCR analysis of alas2, band3 or globins expression at 72 hpf in WT siblings and creg1−/− mutants (n=30 embryos per group). G) o‐dianisidine staining in WT siblings and creg1−/− mutants at 3 dpf. H) Wright‐Giemsa staining of erythrocytes from WT siblings and creg1−/− mutants at 3 dpf. I) Nucleo‐cytoplasmic ratio analysis of erythrocytes from WT siblings and creg1−/− mutants at 3 dpf (n = 15 cells per group). J) WISH assay of hbae1 at 3 dpf for embryos injected with mRNA encoding distinct creg1 mutants. Data shown are the means ± SEM. Statistical significance was calculated using the Student's t‐test. **, p < 0.01; ***, p < 0.001; ****, p < 0.0001; ns, not significant.
|
