FIGURE

Figure 1

ID
ZDB-FIG-240930-31
Publication
Han et al., 2024 - Creg1 Regulates Erythroid Development via TGF-β/Smad2-Klf1 Axis in Zebrafish
Other Figures
All Figure Page
Back to All Figure Page
Figure 1

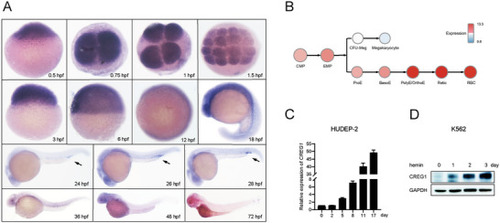
The expression profile of creg1. A) WISH assay of creg1 during early zebrafish embryonic development. The arrows indicate the ICM/PBI region. B) CREG1 mRNA expression in normal human hematopoietic cells was analyzed using BloodSpot database. CMP, Common myeloid progenitor; EMP, Megakaryocyte/erythroid progenitor; ProE, proerythroblasts; BasoE, basophilic erythroblasts; PolyE/OrthoE, polychromatophilic/orthochromatophilic erythroblasts; Retic, reticulocyte; RBC, red blood cell; CFU‐Meg, Colony Forming Unit‐Megakaryocytic. C) Quantitative PCR analysis of CREG1 expression during erythroid differentiation of HUDEP‐2 cells. Data shown are the means ± SEM from three independent experiments. D) Western blot analysis of CREG1 in hemin‐treated K562 cells.

Expression Data

Expression Detail
Antibody Labeling
Phenotype Data

Phenotype Detail
Acknowledgments
This image is the copyrighted work of the attributed author or publisher, and ZFIN has permission only to display this image to its users. Additional permissions should be obtained from the applicable author or publisher of the image. Full text @ Adv Sci (Weinh)