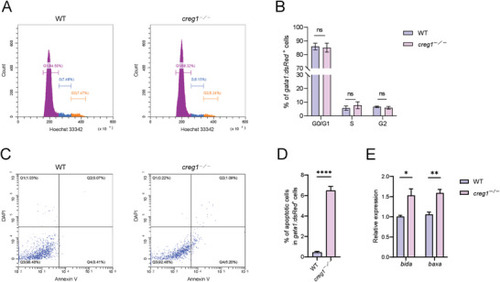
Loss of creg1 results in elevated apoptosis of erythroid cells. A) Cell cycle analysis of gata1:dsRed+ erythroid cells from WT siblings (left) and creg1−/− mutants (right) at 2 dpf. Erythroid cell DNA content was measured by flow cytometry via Hoechst 33342 fluorescence intensity. B) Quantification of the percentage of cells in each cell cycle phase from (A) (n=100 embryos per group). C) FACS analyses of apoptotic cell death were performed with gata1:dsRed+ erythroid cells from WT siblings (left) and creg1−/− mutants (right) at 2 dpf using Annexin V/DAPI staining. D) Quantification of the percentage of gata1:dsRed+ erythroid cells that are Annexin V‐positive from (C) (n = 100 embryos per group). E) Quantitative PCR analysis of bida and baxa expression in gata1:dsRed+ erythroid cells from WT siblings and creg1−/− mutants at 2 dpf (n = 30 embryos per group). Data shown are the means ± SEM. Statistical significance was calculated using the Student's t‐test. *, p < 0.05; **, p < 0.01; ****, p < 0.0001; ns, not significant.
|
