FIGURE

Figure 1

ID
ZDB-FIG-240930-102
Publication
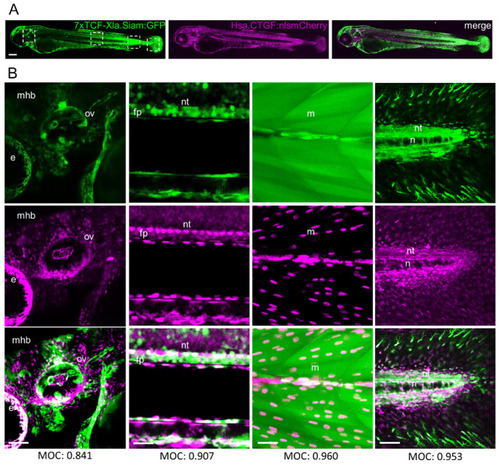
Astone et al., 2024 - Wnt/β-Catenin Signaling Regulates Yap/Taz Activity during Embryonic Development in Zebrafish
Other Figures
All Figure Page
Back to All Figure Page
Figure 1

(A,B) Transgene co-expression pattern of Tg(7xTCF-Xla.Siam:GFP)ia4 and Tg(Hsa.CTGF:nlsmCherry)ia49 reporter lines in 48 hpf embryos. (A). Representative Tg(7xTCF-Xla.Siam:GFP)ia4, Tg(Hsa.CTGF:nlsmCherry)ia49, and merged images showing Wnt (green) and Yap/Taz (magenta) responsive areas. Regions selected by white dashed squares have been zoomed in (B). (B) Magnification of head, trunk, muscles and caudal region views of the maximal projection from three stacks. Abbreviation: mhb (midbrain–hindbrain boundary), ov (otic vesicle), nt (neural tube), n (notochord), fp (floorplate), m (muscle), e (eye). Mander’s overlap coefficient (MOC), Scale bar in (A) = 200 µm; Scale bar in (B) = 25 µm.

Expression Data

Expression Detail
Antibody Labeling
Phenotype Data

Phenotype Detail
Acknowledgments
This image is the copyrighted work of the attributed author or publisher, and ZFIN has permission only to display this image to its users. Additional permissions should be obtained from the applicable author or publisher of the image. Full text @ Int. J. Mol. Sci.