|
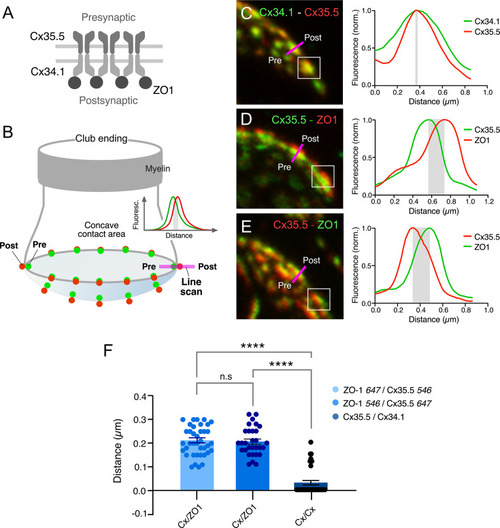
Expansion microscopy reveals the molecular components of gap junction (GJ) plaques at club ending (CE) synaptic contact areas. (A) Schematic representation of the molecular organization of GJs between CEs (presynaptic) and the M-cell (postsynaptic). The presynaptic and postsynaptic hemichannels are formed by Cx35.5 and Cx34.1, respectively. The scaffolding protein, ZO1, is postsynaptic and interacts with Cx34.1. (B) Cartoon of a CE terminal illustrating the concavity of its contact area with the M-cell. The concavity determines differences in the relative position of presynaptic (green) vs. postsynaptic (red) labeling at different points throughout the contact area. Puncta located in the periphery of the contact are ideally aligned to determine colocalization of fluorescence at individual puncta (line scan, inset). (C–E) Line scan of puncta at expanded contact areas showing colocalization of presynaptic Cx35.5 and postsynaptic Cx34.1 (C) (projection of 69 sections at 0.65 µm z-step size), and presynaptic Cx35.5 and postsynaptic ZO1 (D–E) (D: projection of 26 sections at 0.86 µm z-step size; E: projection of 55 sections at 0.60 µm z-step size). The example in (C) is part of the experiment illustrated in Figure 3A. The magenta lines indicate the position of the line scan in each case. The fluorescence intensity profiles for each fluorophore are illustrated on the right side of each panel. As a control, secondary antibodies were swapped in (E). (F) Bar graph illustrates the distance between the peaks of fluorescence intensity profiles for Cx35.5-Cx34.1 labeling (with either 647Atto or 546Alexa-Cx35.5 vs. either 647Atto or 546Alexa-Cx34.1: 0.03 ± 0.010 µm, n = 37 puncta from six fish) and Cx35.5-ZO1 labeling (546Alexa-ZO1 vs. 647Atto-Cx35.5: 0.21 ± 0.011 µm, n = 30 puncta from three fish). Secondary antibodies were swapped as control (647Atto-ZO1 vs. 546Alexa-Cx35.5: 0.21 ± 0.011 µm, n = 39 puncta from eight fish). Bars represent ± SEM (ANOVA analysis with Tukey’s multiple comparison test correction; ****p<0.0001). The scale bars represent actual dimensions; expanded images were not adjusted for expansion factor.
|