FIGURE

Figure 1—figure supplement 1.

ID
ZDB-FIG-240820-2
Publication
Cárdenas-García et al., 2024 - The components of an electrical synapse as revealed by expansion microscopy of a single synaptic contact
Other Figures
All Figure Page
Back to All Figure Page
Figure 1—figure supplement 1.

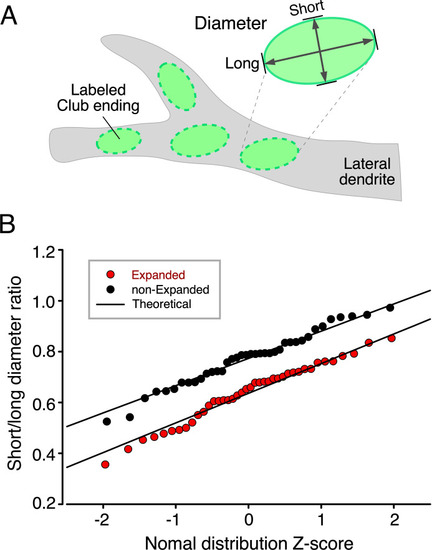
Short–long-diameter ratio probability plots.

(A) Cartoon illustrates labeled club ending (CE) contact areas in the lateral dendrite of the M-cell and the measurement of their short and long diameters. (B) Short–long-diameter ratios obtained from expanded (red circles) and non-expanded (black circles) CE contact areas are shown plotted against their standardized normal Z-scores calculated from sampled cumulative probabilities. Straight lines (Theoretical) show data expected from normally distributed short–long ratios derived from sample means and standard deviations. In both expanded and non-expanded cases, experimental distributions fit theoretical normal distributions well. It may also be observed that the variability of ratios is nearly identical for expanded and non-expanded data, indicating that the expansion process had no selective effects across the CE population.

Expression Data

Expression Detail
Antibody Labeling
Phenotype Data

Phenotype Detail
Acknowledgments
This image is the copyrighted work of the attributed author or publisher, and ZFIN has permission only to display this image to its users. Additional permissions should be obtained from the applicable author or publisher of the image. Full text @ Elife