
Fig. 2
- ID
- ZDB-FIG-240812-14
- Publication
- Guo et al., 2024 - Lysosomal membrane protein TMEM106B modulates hematopoietic stem and progenitor cell proliferation and differentiation by regulating LAMP2A stability
- Other Figures
- All Figure Page
- Back to All Figure Page
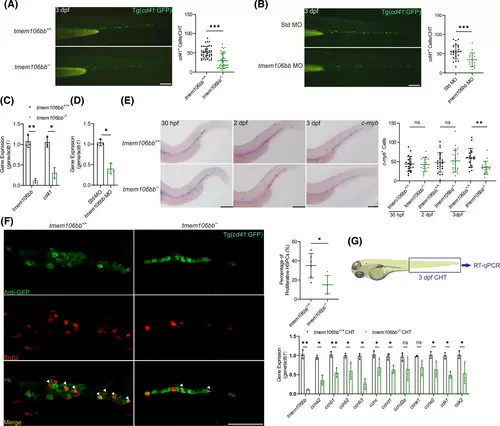
Both KO and knockdown of tmem106bb reduce HSPC proliferation. (A) Signal of cd41+ HSPCs was significantly reduced in CHT of 3 dpf tmem106bb−/−/Tg(cd41:GFP) embryos compared with control tmem106bb+/+/Tg(cd41:GFP) embryos (n = 37–39 embryos per group; scale bar: 200 μm). (B) Signal of cd41+ HSPCs was significantly reduced in CHT of 3 dpf Tg(cd41:GFP) embryos injected with tmem106bb-MO compared with those injected with control Std-MO (n = 16–26 embryos per group; scale bar: 200 μm). (C) RT-qPCR analysis showed that cd41 expression was significantly decreased in tmem106bb−/− embryos compared with wild-type tmem106bb+/+ embryos at 3 dpf (n = 3 samples per group with 50 embryos in each sample). (D) RT-qPCR analysis showed that cd41 expression was significantly decreased in 3 dpf embryos injected with tmem106bb-MO compared with those injected with control Std-MO (n = 3 samples per group with 50 embryos in each sample). (E) WISH for HSPC marker c-myb with tmem106bb−/− and tmem106bb+/+ embryos at 30 hpf, 2 and 3 dpf (n = 16–24 embryos per group; scalebar: 200 μm). (F) Cell proliferation analysis with BrdU staining of 3 dpf tmem106bb−/−/Tg(cd41:GFP) and control tmem106bb+/+/Tg(cd41:GFP) embryos. The number of proliferating HSPCs (white triangle arrows) was significantly reduced by tmem106bb KO (n = 6 embryos per group; scale bar: 50 μm). Green signals represent cd41+ HSPCs, red signals indicate BrdU-labeled proliferating cells and yellow signals represent proliferating HSPCs. (G) RT-qPCR analysis for genes involved in cell cycle regulation with CHT samples of 3 dpf tmem106bb−/− and control tmem106bb+/+ embryos (n = 3 samples per group with 50 embryos in each sample). *p < .05, **p < .01, ***p < .001, ns, no significance; Data were shown as mean ± SD; Statistical analysis was performed using a Shapiro–Wilk test for samples with normal distribution and unpaired (A, B, E, F) or paired (C, D, G) student's t tests with two tail. |