
Fig. 5
- ID
- ZDB-FIG-240807-5
- Publication
- Fuentes et al., 2024 - Maternal regulation of the vertebrate oocyte-to-embryo transition
- Other Figures
- All Figure Page
- Back to All Figure Page
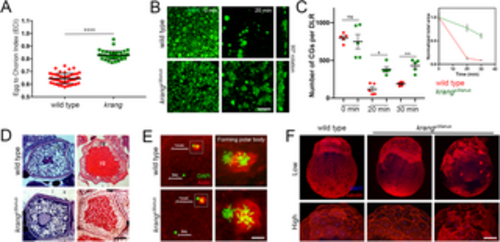
Characterization of the maternal-effect krang mutant phenotype. A. Quantification of the chorion elevation phenotype. Scatter plots of the measured ECI value show a penetrant chorion elevation defect in the krang mutant egg at 30 mpa (ECI = 0.64 and 0.83; SD = 0.006 and 0.005; for the wild-type (n = 48, 2 females) and mutant (n = 48, 2 females) egg, respectively). SD = standard deviation. Data are means ± SD. ****p<0.0001 in statistical clustering analysis in a nonparametric unpaired t test of chorion elevation measurements. B. Confocal z-projections (5 μm depth) of MPA stained CGs showing their distribution in wild-type (top row, n = 68 eggs from 3 females) and krang mutant (bottom row, n = 55 eggs from 3 females) eggs at two different time points after activation. Images were taken in a determined lateral region (DLR) of each activated egg. Notice that smaller, possibly CGs lacking MPA-staining lectin accumulate in the mutant egg at 20 mpf. C. Scatter plots of CG exocytosis timing measured in the DLR of the activated egg. The average number of CGs in the krang mutant was not reduced compared to wild type at 0 min but is significantly higher at later time points. Normalized total area curves (upper right graph) showing CG exocytosis rate in wild-type and krang mutant activated eggs. Five eggs from 3 females per genotype and per time point were used in this analysis. Data are means ± SEM. *p = 0.0131 and **p = 0.0252 in a parametric statistical two-way ANOVA test. ns, not significant. D. Hematoxylin and Eosin stained sections of intact stage II (left column) and stage III (right column) oocytes. Wild-type (n = 2 ovaries), and krang (n = 2 ovaries) oocytes, were phenotypically comparable. CGs are formed (stage II) and accumulated at the cortex (stage III). E. Confocal micrographs of actin- and DAPI-stained fertilized eggs showing normal meiosis completion and second polar body formation (wild type (n = 6, 2 females) and mutant (n = 15, 2 females). F. Most krang mutant embryos failed to undergo cell divisions. Top row: wild-type embryo with a typical symmetric blastoderm at 2 hpf (left panel, n = 87/93 embryos from 2 females). In contrast, krang mutant embryos display relatively normal (middle panel, n = 78/227) or abnormal (right panel, n = 147/227) blastoderm formation (n = 3 mutant females). Bottom row: high magnification confocal micrographs showing the cell architecture in wild-type and mutant blastoderms. cg, cortical granule; yg, yolk globules. Scale bar = 40 μm (B), 25 μm (D, left column), 95 μm (right column), 50 μm (E, left column), 12 μm (E, right column), 160 μm (F, top row), 85 μm (F, bottom row). |