
Fig. 2
- ID
- ZDB-FIG-240807-2
- Publication
- Fuentes et al., 2024 - Maternal regulation of the vertebrate oocyte-to-embryo transition
- Other Figures
- All Figure Page
- Back to All Figure Page
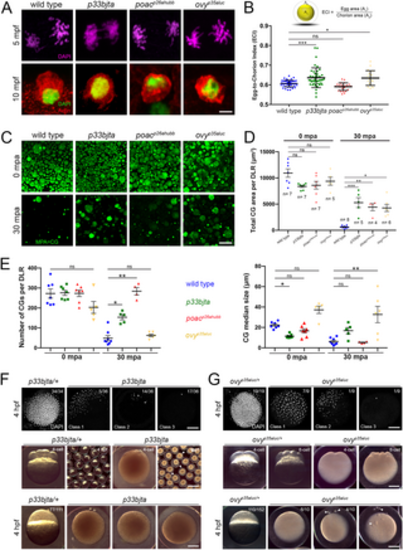
Meiosis II completion and egg activation defect in dark eggs mutants. A. Confocal micrographs of the animal pole show anaphase of meiosis II at 5 mpa and the extruded polar body at 10 mpa. Top row: DAPI-stained wild-type (n = 24), p33bjta (n = 14), poacp26ahubb (n = 22) and ovyp35aluc (n = 21) sister chromatids during meiotic anaphase II. Bottom row: Phalloidin-stained actin (red) and DAPI staining (green) of second polar bodies in wild-type (n = 14), p33bjta (n = 9), poacp26ahubb (n = 12) and ovyp35aluc (n = 10) activated eggs. Scale bar = 4 μm. B. Egg-to-chorion index (ECI) is the ratio of egg area (A1) to chorion area (A2) as a measure of chorion elevation. Scatter plots of the ECI measured in activated eggs at 30 mpa. The wild-type egg ECI value (ECI = 0.61; SD = 0.02; n = 65) defines the numerical value for normal chorion elevation. The ECI for the eggs from p33bjta (ECI = 0.64; SD = 0.05; n = 44, 2 females) and ovyp35aluc (ECI = 0.63; SD = 0.03; n = 20, 2 females) mutant females are significantly different to wild type, while the eggs of poacp26ahubb (ECI = 0.59; SD = 0.02; n = 25, 2 females) mutant females show a mean value similar to wild type. SD = standard deviation. Data are means ± SD. *p = 0.0131 and ***p = 0.0004 in parametric statistical Tukey’s test. C. Confocal z-projections (5 μm depth) of acid fixed and MPA stained wild-type and mutant activated eggs. In wild-type (n = 60), p33bjta (n = 55), ovyp35aluc (n = 25), and poacp26ahubb (n = 27) eggs, numerous large and small CGs were distributed throughout the cortex at 0 mpa. At 30 mpa, wild-type (n = 21), p33bjta (n = 28), poacp26ahubb (n = 20) and ovyp35aluc (n = 18), eggs displayed fewer CGs, indicating that they were released following activation. However, some CGs persisted in p33bjta (5/28), poac (11/20) and ovyp35aluc (6/18) mutant eggs. D. Scatter plots of CG retention measured in a determined lateral region (DLR) of activated wild-type and opaque mutant eggs. The total area of retained CGs per total DLR area in all dark egg mutants was significantly increased compared to wild type at 30 mpa. n, number of eggs used in this analysis from 3 females. Data are means ± SEM. *p = 0.0249, **p = 0.0485 between wild type and poac, and ***p = 0.0042 between wild type and p33bjta in a nonparametric statistical Kruskal-Wallis test. ns, not significant; mpa, minutes post-activation. E. Scatter plots of CG number (top graph) and median size (bottom graph) measured in the DLR of the wild-type and dark activated eggs. The average number of CGs in the mutants was comparable to wild type at 0 mpa but significantly different in the p33bjta and poacp26ahubb mutants at 30 mpa. Unactivated (wild type (n = 7), p33bjta (n = 7), poacp26ahubb (n = 7) and ovyp35aluc (n = 5)) and activated (wild type (n = 8), p33bjta (n = 5), poacp26ahubb (n = 4) and ovyp35aluc (n = 6)) eggs from 3 females per genotype were used in this analysis. Data are means ± SEM. Top graph: *p = 0.0353 and **p = 0.0012 in a nonparametric statistical Kruskal-Wallis test. Bottom graph: *p = 0.0250 in a nonparametric statistical Kruskal-Wallis test, and **p = 0.0011 in a parametric statistical Tukey’s test. F. Top row: Animal views of DAPI stained p33bjta/+ (n = 34, 2 females), and p33bjta (n = 36, 2 mutant females) 4 hpf embryos, showing abnormal chromatin organization. Middle row: Lateral views of 4-cell stage embryos from p33bjta/+ (n = 77/111, N = 2 females), and p33bjta (n = 29/59, N = 3) females. Bottom row: Lateral views of 4 hpf embryos from p33bjta/+ (n = 77/111, N = 2) and p33bjta (n = 29/59, N = 3) females. G. Top row: Animal views of DAPI stained 4 hpf embryos from ovyp35aluc/+ (n = 19, N = 2), and ovyp35aluc (n = 9, N = 2 females), showing abnormal chromatin organization. Middle row: Lateral views of 4- and 8-cell stage embryos from two heterozygous (n = 110), and one homozygous (n = 69) ovyp35aluc females. Bottom row: Lateral views of 4 hpf embryos from 2 heterozygous (n = 110), and one homozygous (n = 10) ovyp35aluc females. hpf, hours post fertilization. Scale bar = 4 μm (A), 40 μm (C), 210 μm (F, G). |