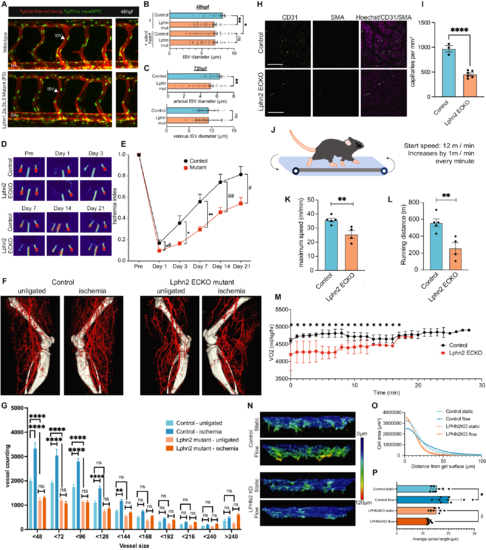
Latrophilin-2 in flow-induced vascular remodeling. (A) Representative images of ISVs from 48 hpf embryos with F(0)/mosaic depletions of latrophilin genes or controls. (B) Quantification of diameters of all ISVs in (A). n = 15 per condition. *P = 0.0452, **P = 0.0150; one-way ANOVA with Tukey’s multiple comparisons test. (C) Quantification of diameters of arterial and venous ISVs at 72 hpf of zebrafish. n = 6 per condition. **P = 0.0013; Student’s t test. (D) Ratio of blood flow in the right ischemic vs left control foot by laser doppler, quantified in (E). N = 7–8 per condition. *,#P = 0.0439, *P = 0.0135, **P = 0.0028, ##P = 0.0056, #P = 0.0163; Student’s t test. (F) Micro-CT of arterial vasculature after surgery. Representative reconstructed micro-CT images from LPHN2 ECKO and WT littermates on day 22 after surgery, quantified in (G). n = 8 per condition. ****P < 0.0001, ***P = 0.0007, *P = 0.0167; two-way ANOVA with Tukey’s multiple comparisons test. (H) Rectus femoris muscle from thighs of 10-week-old mice of LPHN2 ECKO or wild-type littermates, stained for CD31 and SMA to visualize the entire vasculature and arteries. Scale bar: 100 µm. (I) Quantification of capillary density in the entire stitched thigh muscle images. n = 3 for control and n = 6 for Lphn2 ECKO. ****P < 0.0001; Student’s t test. (J) Schematic of mouse treadmill fatigue test. (K) Maximum running during test. n = 4 for control and n = 5 for Lphn2 ECKO. **P = 0.0082; Student’s t test. (L) Running distance for each mouse. n = 4 for control and n = 5 for Lphn2 ECKO. **P = 0.0064; Student’s t test. (M) Oxygen consumption during treadmill fatigue test. *P < 0.0001; two-way ANOVA with Tukey’s multiple comparisons test. Control: N = 5, LPHN2 ECKO: N = 4. (N) Representative 3D reconstructed images at 20° downward angle of ECs plated on top of collagen gels and sprouting under static or flow conditions. ECs were stained with phalloidin; pseudocolors indicate distance from the gel surface as per the color scale on the right. (O) Histograms of cell area vs. distance from gel surface in (N). (P) Mean sprout length. N = 4. ***P = 0.0006; one-way ANOVA with Tukey’s multi-comparison test.
|
