
Fig. 3
- ID
- ZDB-FIG-240802-3
- Publication
- Tanaka et al., 2024 - Latrophilin-2 mediates fluid shear stress mechanotransduction at endothelial junctions
- Other Figures
- All Figure Page
- Back to All Figure Page
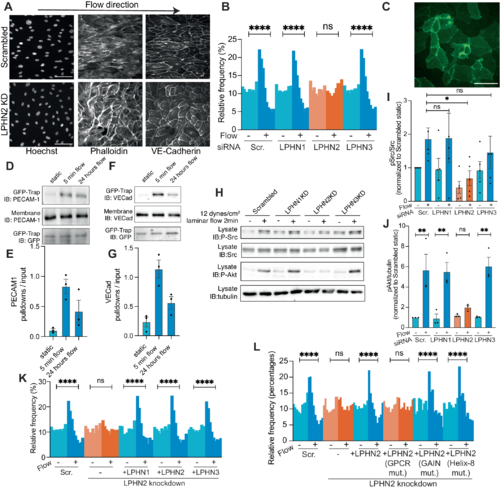
Latrophilins regulate endothelial flow responses. (A) HUVECs with or without latrophilin-2 knockdown were subjected to FSS for 16 h, then fixed and stained with Hoechst (nuclei), phalloidin (F-actin) and an antibody against VE-Cadherin. Scale bar: 100 µm. (B) Alignment of HUVECs (each bar = 10° increments) after knockdown of latrophilin isoforms was quantified as in Fig. 1 from >2000 cells/experiment, N = 3. ****P < 0.0001; one-way ANOVA with Tukey’s multiple comparisons test. (C) Localization of LPHN2-mClover3. Scale bar: 100 µm. N = 6. (D) Gi1(Q306K) pulldown from ECs ± FSS for 5 min or for 24 h, probed for PECAM-1. N = 3, quantified in (E). (F) Gi1(Q306K) pulldown from ECs ± FSS for 5 min or for 24 h probed for VE-cadherin. N = 3, quantified in (G). (H) Activation of Src family kinases and Akt by FSS in HUVECs depleted for latrophilin isoforms. N = 3–4, quantified in (I, J). *P = 0.0184, **P < 0.001; one-way ANOVA with Tukey’s multiple comparisons test. (K) Alignment of LPHN2-depleted HUVECs rescued by re-expression of the indicated latrophilin isoforms. ****P < 0.0001; one-way ANOVA with Tukey’s multiple comparisons test. Quantification of >2000 cells for each condition, N = 3. (L) LPHN2 knockdown HUVECs were rescued by re-expression of the indicated LPHN2 mutants. ****P < 0.0001, one-way ANOVA with Tukey’s multiple comparisons test. Quantification of >500 cells for each condition. |