
Fig. 7
- ID
- ZDB-FIG-240513-29
- Publication
- Tanimoto et al., 2024 - Transgenic tools targeting the basal ganglia reveal both evolutionary conservation and specialization of neural circuits in zebrafish
- Other Figures
- All Figure Page
- Back to All Figure Page
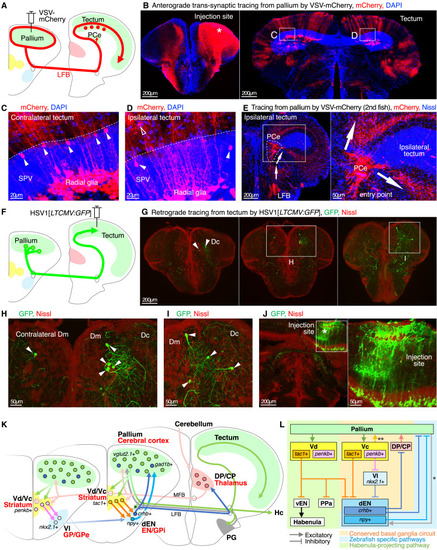
Visualization of output pathways from the pallium to the tectum (A) Illustration of VSV-mCherry injection into the pallium and anterogradely trans-synaptically labeled tectal neurons. (B) VSV-mCherry injection into the pallium and immunohistochemistry of mCherry (red) and DAPI (blue). An asterisk in the left panel indicates an approximate injection point. Insets at the bilateral tectum in the right panel show the positions of (C) and (D). MaxIP is shown. Scale bars, 200 μm. (C and D) Magnified views of the bilateral tectum. Dotted line indicates the boundary between the SPV and the upper layer. Filled arrowheads indicate labeled tectal neurons in the shallower layers of the SPV, and an open arrowhead indicates one outside the SPV. Radial glia were also labeled in the deeper layers of the SPV. Scale bars, 20 μm. (E) VSV-mCherry injection into the pallium of another fish visualized entering pallio-tectal projection fibers from the LFB to the ipsilateral tectum and PCe (arrows). An inset shows the position of the right panel. MaxIP is shown. Scale bars, 200 μm (left panel) and 50 μm (right panel). (F) Illustration of HSV1[LTCMV:GFP] injection into the tectum and retrogradely labeled neurons in the pallium. (G) HSV1[LTCMV:GFP] injection into the tectum and immunohistochemistry of GFP (green) and Nissl (red). Three coronal sections at the telencephalon are shown. Arrowheads indicate retrogradely labeled pallial neurons. Insets show the positions of (H) and (I) (focusing on the pallium). MaxIP is shown. Scale bars, 200 μm. (H and I) Magnified views of the retrogradely labeled pallial neurons in the Dm and Dc (arrowheads). Scale bars, 50 μm. (J) A section at the tectum from the same animal as (G)–(I). An inset at the injection site in the tectum is magnified in the right panel. An asterisk indicates an approximate injection point. MaxIP is shown. Scale bars, 200 μm. (K and L) Schematic diagrams of the zebrafish cortico-basal ganglia-thalamic network elucidated in this study. See also Figure 1D. A pathway marked with asterisk is based on Aoki et al.2 and Lal et al.7 A pathway marked with double asterisk is based on the observation of putative axonal projections and lacks the evidence of synaptic connections with the pallial neurons (see Figures S2A and S2B). |