
Fig. 1
- ID
- ZDB-FIG-240513-23
- Publication
- Tanimoto et al., 2024 - Transgenic tools targeting the basal ganglia reveal both evolutionary conservation and specialization of neural circuits in zebrafish
- Other Figures
- All Figure Page
- Back to All Figure Page
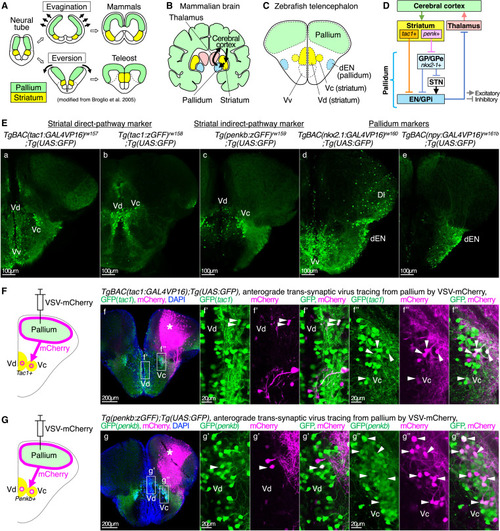
Transgenic and viral tools for anatomical characterization of specific neural subpopulations in the zebrafish basal ganglia (A) Comparison of developmental processes of the mammalian and teleost brains (modified from Broglio et al.3). Areas colored with green and yellow indicate the pallium and the striatum, respectively. (B and C) Comparison of cortico-basal ganglia circuits of the mammalian and zebrafish brains. Coronal sections are shown. The evolutionarily homologous brain regions are in the same color. Vd/Vc, dorsal/central nucleus of the ventral telencephalic area; dEN, dorsal entopeduncular nucleus; Vv, ventral nucleus of the ventral telencephalic area. (D) Schematic diagram of the mammalian cortico-basal ganglia circuit. (E) Expression patterns of the Gal4-driver lines for direct-pathway striatal neurons (tac1 promoter, a and b), indirect-pathway striatal neurons (penkb promoter, c), and pallidal neurons (nkx2.1 and npy promoters, d and e). Each Gal4-driver line was combined with Tg(UAS:GFP). Coronal sections in the anterior telencephalon are shown. Scale bars, 100 μm. (F) Illustration of a coronal section depicting VSV-mCherry injection into the pallium and anterogradely labeled tac1+ neurons in the Vd/Vc. (f) Actual results from VSV-mCherry injection into the pallium of TgBAC(tac1:GAL4VP16);Tg(UAS:GFP) fish and immunohistochemistry of GFP (green), mCherry (magenta), and DAPI (blue). An asterisk indicates an approximate injection point. Insets show the positions of f’ (focusing on Vd) and f’’ (focusing on Vc), where arrowheads indicate GFP and mCherry double-positive neurons. (f) Maximum-intensity projection (MaxIP) of the whole z stacks obtained from a histological section, whereas (f’) and (f’’) show a single confocal optical section. Scale bars, 200 μm (f) and 20 μm (f’ and f’’). (G) Same as (E), but in Tg(penkb:zGFF);Tg(UAS:GFP) fish. |