
Fig. 2
- ID
- ZDB-FIG-240513-24
- Publication
- Tanimoto et al., 2024 - Transgenic tools targeting the basal ganglia reveal both evolutionary conservation and specialization of neural circuits in zebrafish
- Other Figures
- All Figure Page
- Back to All Figure Page
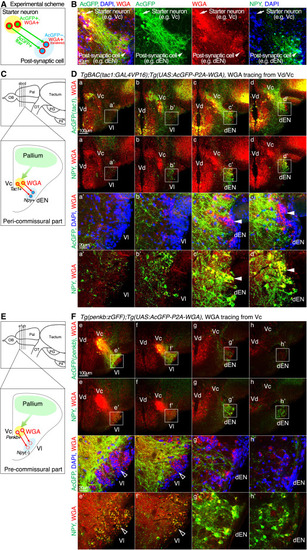
WGA tracing from the tac1+ and penkb+ striatal neurons caused WGA accumulation preferentially in the dEN and Vl, respectively (A) Schematic illustration of the WGA tracing using Tg(UAS:AcGFP-2A-WGA) in this study. Starter neurons express AcGFP and WGA, their projecting fibers mainly express AcGFP, and the neighboring post-synaptic cells accumulate anterogradely transferred WGA. (B) An example of the WGA tracing experiment from the starter neurons to the post-synaptic neurons (the same sample as c in D). Scale bar, 40 μm. (C) Illustration of a coronal section depicting WGA tracing from the tac1+ Vc neurons and trans-synaptic WGA transfer to the npy+ dEN neurons at the peri-commissural telencephalon. (Top) The lateral view of the zebrafish brain, and the dashed lines indicate antero-posterior positions of the coronal sections (a)–(d) shown in (B). OB, olfactory bulb; Pal, pallium; OT, optic tract; PG, preglomerular nucleus; Pit, pituitary. (D) WGA expression in the tac1+ Vd/Vc neurons and immunohistochemistry of AcGFP (green), WGA (red), DAPI (blue), and NPY (green). Four successive coronal sections (a–d) are shown so that the first two sections contain the NPY-negative Vl region and the latter two sections contain the NPY+ dEN region. Insets in (a)–(d) (top two rows) show the positions of (a’)–(d’) (bottom two rows), focusing on the Vl or dEN. In (c’)–(d’), arrowheads indicate representative NPY+ dEN neurons with WGA signals. Scale bars, 100 μm (a–d) and 20 μm (a’–d’). (E and F) Same as (C) and (D), but from the penkb+ Vc neurons and trans-synaptic WGA transfer to the NPY-negative Vl neurons at the pre-commissural telencephalon. In (e’)–(f’), open arrowheads indicate representative NPY-negative Vl neurons with WGA signals. |