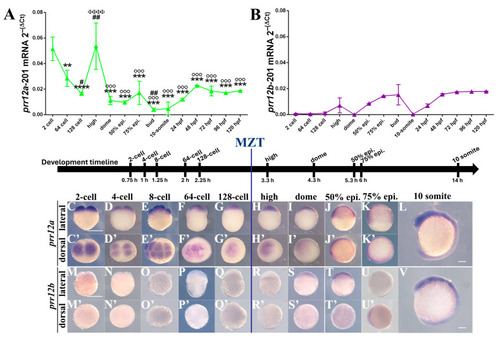
prr12a and prr12b display a different spatio-temporal expression pattern during zebrafish early development. (A,B) Real-time PCR profile of prr12a-201 (A) and prr12b-201 (B) at increasing developmental stages (epi.: epiboly; hpf: hours post fertilization). Ct values for each timepoint are normalized to rps11 gene. Asterisks (*) indicate statistical comparisons between each stage and 2 cell stage; hash marks (#) indicate statistical comparisons between each stage and 64 cell stage; Phi (Φ) indicate statistical comparison between each stage and 128 cell stage; degree symbol (°) indicate statistical comparison between each stage and high stage. Data are expressed as mean ± SD. ANOVA followed by Tukey post hoc test: ** p < 0.01; *** p < 0.001; **** p < 0.0001; # p < 0.05; ## p < 0.01; ΦΦΦΦ p < 0.0001; °°° p < 0.0001. n = 2 independent experiments. (C–V) WISH using prr12a-201 anti-sense (C–L) and prr12b-201 (M–V) anti-sense probes at early developmental stages. Lateral (C–L,M–V) and dorsal (C’–K’,M’–U’) views of the hybridized embryos. Scale bars: 250 µm. Abbreviations: epi.: epiboly h: hours; MZT: maternal-to-zygotic transition.
|
