IMAGE

Figure 2

ID
ZDB-IMAGE-240429-124
Genes
Source
Figures for Muscò et al., 2024
Image
Figure Caption

Figure 2

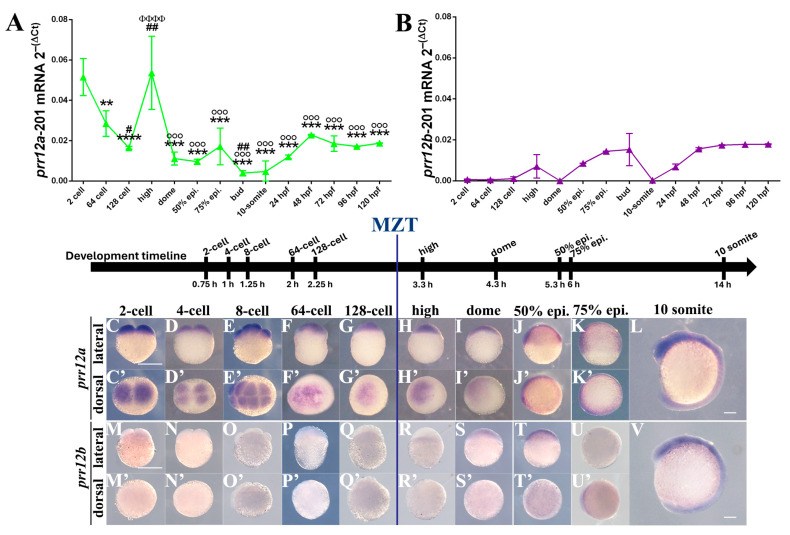
prr12a and prr12b display a different spatio-temporal expression pattern during zebrafish early development. (A,B) Real-time PCR profile of prr12a-201 (A) and prr12b-201 (B) at increasing developmental stages (epi.: epiboly; hpf: hours post fertilization). Ct values for each timepoint are normalized to rps11 gene. Asterisks (*) indicate statistical comparisons between each stage and 2 cell stage; hash marks (#) indicate statistical comparisons between each stage and 64 cell stage; Phi (Φ) indicate statistical comparison between each stage and 128 cell stage; degree symbol (°) indicate statistical comparison between each stage and high stage. Data are expressed as mean ± SD. ANOVA followed by Tukey post hoc test: ** p < 0.01; *** p < 0.001; **** p < 0.0001; # p < 0.05; ## p < 0.01; ΦΦΦΦ p < 0.0001; °°° p < 0.0001. n = 2 independent experiments. (CV) WISH using prr12a-201 anti-sense (CL) and prr12b-201 (MV) anti-sense probes at early developmental stages. Lateral (CL,MV) and dorsal (C’K’,M’U’) views of the hybridized embryos. Scale bars: 250 µm. Abbreviations: epi.: epiboly h: hours; MZT: maternal-to-zygotic transition.

Figure Data
Acknowledgments
This image is the copyrighted work of the attributed author or publisher, and ZFIN has permission only to display this image to its users. Additional permissions should be obtained from the applicable author or publisher of the image. Full text @ Genes (Basel)