|
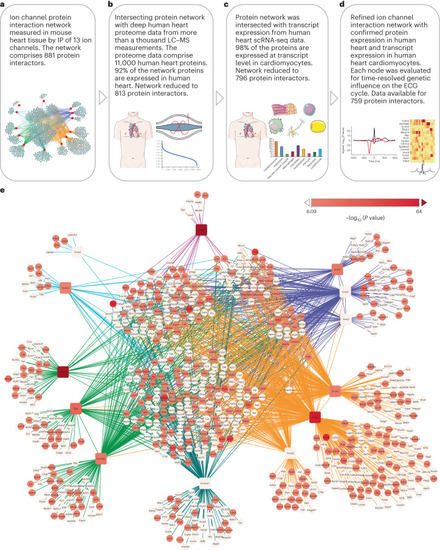
Network nodes associated with genetic influence on human heart ECG. a, We constructed a combined protein–protein interaction network of all 13 channel interactomes, which in total comprise 881 protein interactors. Channel bait proteins are shown in red squares, interactors in gray-blue circles. Edges are colored to indicate clusters of ion channels that contribute to similar electrophysiological components. b, The network from a was filtered for proteins that were measured in human heart samples by analyzing more than a thousand MS-based proteomics measurement files from human heart samples. Ninety-two percent of the proteins in the network were identified in the human heart samples (details in Supplementary Fig. 4a and Supplementary Table 9). c, We utilized human heart single-nucleus RNA sequencing data to determine which of the interactors were expressed in human cardiomyocytes. We found evidence of expression for 98% of the interactors (details in Supplementary Fig. 4b and Supplementary Table 9). d, The remaining 796 human heart, cardiomyocyte-expressed, interactors were evaluated using ECG plotter tool. For each protein, this generates a time series of associations across the ECG cycle. For each protein, we report the most significant association. e, Refined network of the 13 channel bait proteins and their human heart-cardiomyocyte-expressed interactors. Bait proteins are depicted in squares, interactors in circles. The color of the nodes indicates the significance of the influence on the ECG as determined by ECG plotter. A darker red color indicates a more significant association. The 340 proteins with a significant influence (P < 8.23 × 10⁻⁷ resulting network supports the notion that the combined ion channel network is enriched for proteins that influence the cardiac ECG. GWAS P values were extracted from Verweij et al.33 and adjusted for multiple comparisons (details in Methods and Source Data Fig. 7). Parts of the figure were drawn by using pictures from Servier Medical Art. Servier Medical Art by Servier is licensed under a Creative Commons Attribution 3.0 Unported License (https://creativecommons.org/licenses/by/3.0/). Source data
|