|
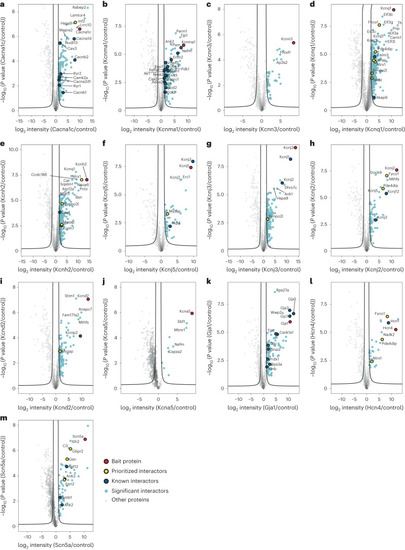
Volcano plot representation for analysis of significant interactors for each channel bait. Volcano plots for each ion channel bait. a, Cacna1c. b, Kcnma1. c, Kcnn3. d, Kcnq1. e, Kcnh2. f, Kcnj5. g, Kcnj3. h, Kcnj2. i, Kcnd2. j, Kcna5. k, Gja1. l, Hcn4. m, Scn5a. All dots represent a protein, where the negative logarithm (base 10) of t-test-derived P value is shown as a function of logarithmic (base 2) ratios of protein intensities in bait pulldowns relative to controls. The control comparator is based on median protein intensities across 64 IP experiments, IgG pulldowns and scaled proteome measurements as well as imputation, and the black line indicates an FDR-based cutoff that considers the fold change difference of protein intensities to demarcate the specific from nonspecific interactors. The claim to significance was based on FDR of a two-sided t-test and s0 value (s0 controls the relative importance of t-test-based P value and difference between means). For details, see Extended Data Fig. 2b and Supplementary Table 2. Proteins shown as light-blue dots represent specific interactors for the bait, red dot is the bait protein itself, dark-blue dot represents interactors with previously reported functional influence on the bait, and yellow dots are protein interactors that we have prioritized for functional investigations based on evaluation of the acquired MS data. Source data
|