FIGURE

Fig. 5

ID
ZDB-FIG-240426-64
Publication
Maurya et al., 2023 - Outlining cardiac ion channel protein interactors and their signature in the human electrocardiogram
Other Figures
All Figure Page
Back to All Figure Page
Fig. 5

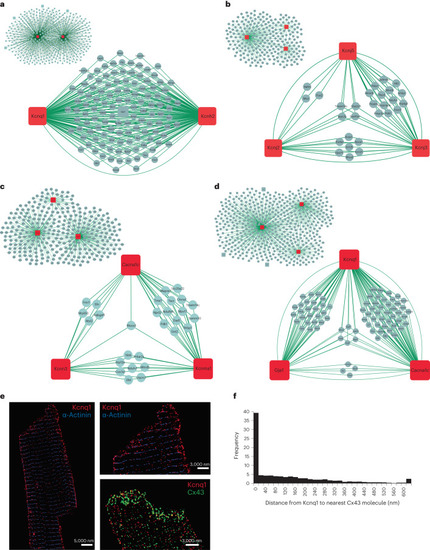
Inter-channel networks. Networks of shared proteins between channels found to interact.

ad, Kcnq1 and Kcnh2 (a), between Kcnj2, Kcnj3 and Kcnj5 (b), between Cacna1c, Kcnn3 and Kcnma1 (c), and between Kcnq1, Gja1 and Cacna1c (d). The inset panels show all shared interactors for these channels. The bait proteins are shown in red squares and the interactors in light-blue circles. Measured interactions are indicated by lines. Note the interactions between channel proteins. e, STORM images of murine cardiomyocytes for Kcnq1 (red) and Gja1 (green). α-Actinin shown in blue as a control. f, Quantification of images as those shown in e shows that 40% of Kcnq1 clusters localize within 20 nm from Gja1 clusters. Twenty cells were examined over three mice in independent experiments.

Source data

Expression Data

Expression Detail
Antibody Labeling
Phenotype Data

Phenotype Detail
Acknowledgments
This image is the copyrighted work of the attributed author or publisher, and ZFIN has permission only to display this image to its users. Additional permissions should be obtained from the applicable author or publisher of the image. Full text @ Nat Cardiovasc Res