|
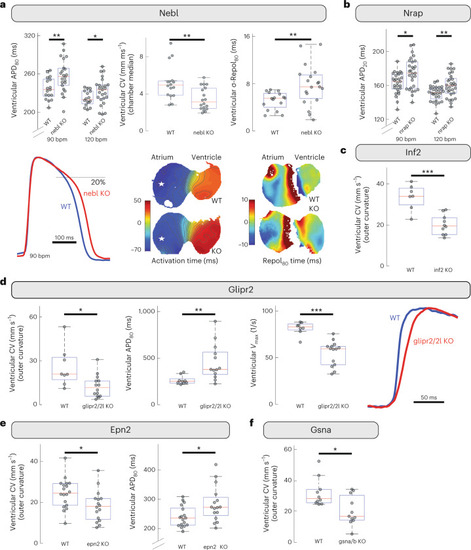
Functional evaluation of channel interactors by gene knock out in zebrafish The functional consequences after acute KO of six interactors of three major ion channels—Kcnq1 (Nebl and Nrap), Cacna1c (Inf2) and Scn5a (Glipr2, Epn2 and Gsn)—were evaluated in zebrafish. a, Compared with control siblings (WT, n = 16 fish), KO of the gene encoding Kcnq1-interacting nebl (nebl KO, n = 23) led to prolongation of the ventricular action potential starting shortly after the plateau, with the greatest effect size at slower heart rate and later in repolarization (APD80, action potential duration measured at 80% recovery; bpm, beats per minute; **P = 8.4 × 10⁻³; *P = 0.037 by two-sided Mann–Whitney U test; exemplar amplitude-normalized optical action potentials shown below), reduced ventricular CV (sinus rhythm; **P = 4.2 × 10⁻³ by idem; exemplar relative activation time maps are zero-referenced to activation of the AV-Ring; white stars indicate area of global earliest activation, isochrones denote 5 ms intervals), and increased spatial dispersion of repolarization (σ-Repol80, standard deviation of repolarization time at 80% recovery across the chamber; sinus rhythm; **P = 8.74 × 10⁻³, idem; in exemplar relative repolarization80 time maps, each chamber is zero-referenced to median repolarization time). b, KO of Kcnq1-interacting nrap (n = 29) led to prolongation of ventricular action potential with greatest effect size in early repolarization (APD20) and at faster heart rates (*P = 0.016; **P = 5.22 × 10⁻³, idem, nWT = 27). c, Knockdown of Cacna1c-interacting inf2 (n = 10) caused a significant decrease in ventricular CV (***P = 7.2 × 10⁻⁴, idem, nWT = 7). d, KO of Scn5a-interacting glipr2/glipr2l (n = 14) decreased ventricular CV (*P = 0.013) and rate of the action potential upstroke (Vmax; ***P = 2.61 × 10⁻⁴, exemplar amplitude normalized action potential upstrokes shown) as well as increasing ventricular APD (**P = 2.7 × 10⁻³, all by idem, nWT = 9). e, KO of Scn5a-interacting epn2 (n = 16) resulted in decreased ventricular CV (*P = 0.020) and increased ventricular APD80 (*P = 0.035, idem, nWT = 18). f, Decrease in ventricular CV was also observed after KO of Scn5a-interacting gsna/b (n = 11, *P = 0.027, idem, nWT = 10). Each point in the box plots corresponds to an individual zebrafish embryo. Box plots indicate 25th/50th/75th percentiles, while whiskers extend to the most extreme data within 1.5× of interquartile range beyond box limits. Source data
|