|
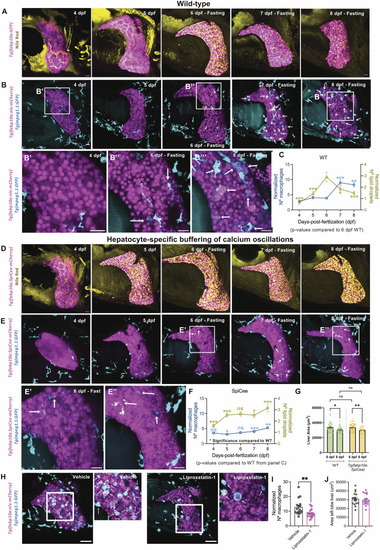
Reduction in the size of liver upon accumulation of lipid droplets during starvation. (A) Maximum-intensity projections (MIP) of Tg(fabp10a:GFP) (referred to as WT) stained with Nile Red. Hepatocytes are false-colored in pink and lipid droplets in yellow. A timeline from 4 to 8 dpf of zebrafish larvae without exogenous food is presented. (B) Representative MIP images of timeline from Tg(fabp10a:nls-mCherry); Tg(mpeg1.1:EGFP) zebrafish from 4 to 8 dpf under the fasting condition. Arrows label macrophages with hepatocyte debris. A zoom of boxed regions is presented below the images. (C) Line trace representing lipid droplets and macrophages normalized to the liver area from 4 to 8 dpf. Comparisons with 6 dpf are represented. P-values: * < 0.05; ** < 0.01, and *** < 0.001, ANOVA test followed by the post hoc Tukey test. (D) MIP of Nile Red staining of Tg(fabp10a:SpiCee-mCherry), with hepatocytes false-colored in pink and lipid droplets in yellow. Representative images from 4 to 8 dpf fasting are presented. (E) Livers from 4 to 8 dpf from fasting Tg(fabp10a:SpiCee-mCherry); Tg(mpeg1.1:EGFP) are presented with MIP. Macrophages with hepatocyte debris are marked with arrows. A zoom of boxed regions is presented below the images. (F) Line trace representing lipid droplets and macrophages normalized to the liver area from 4 to 8 dpf in Tg(fabp10a:SpiCee-mCherry) animals. Comparisons with WT are shown. P-values: ns, not significant, * < 0.05, ** < 0.01, and *** < 0.001, t test or Mann–Whitney U test depending on the normality of the data. (G) Mean ± SEM of liver size in WT and Tg(fabp10a:SpiCee-mCherry) at 6 and 8 dpf without exogenous feeding. P-values: ns, not significant, * < 0.05, and ** < 0.01, t test. (H) Snapshots of livers at 8 dpf from Tg(fabp10a:nls-mCherry); Tg(mpeg1.1:GFP) fasting animals treated with 0.17% DMSO (vehicle) or 50 μM liproxstatin-1. Hepatocytes are false-colored in pink, and macrophages are false-colored in cyan. White arrows indicate macrophages with hepatocyte phagocytosis. (I) Mean ± SEM of the number of macrophages normalized by liver area in vehicle- and liproxstatin-1–treated animals. Each point represents a single animal. **P < 0.01, Mann–Whitney U test. (J) Mean ± SEM of the liver area in control and liproxstatin-1–treated animals at 8 dpf. Scale bar for all panels = 20 μm.
|