|
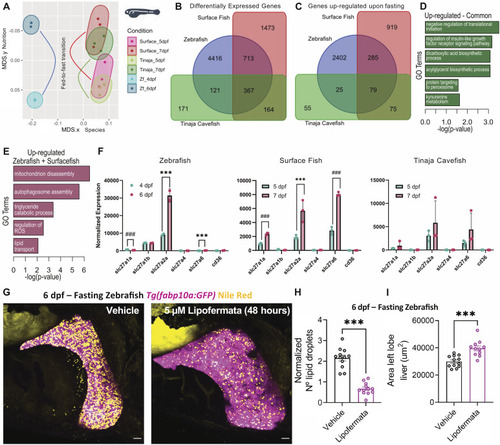
Slc27a2a is responsible for starvation-induced lipid accumulation. (A) Multidimensional scaling plot of gene expression changes in the liver upon fasting in zebrafish, surface fish, and Tinaja cavefish. For zebrafish, livers from 4 dpf were compared with 6 dpf, whereas for surface and cavefish, the comparison was made between 5 and 7 dpf. (B, C) Venn diagram of differentially expressed genes (B) and genes up-regulated by fasting (C) for the three animals. (D, E) Gene ontology (GO) analysis for genes up-regulated by fasting in all the three animals (D) and for zebrafish and surface fish only (E). (F) Barplot displaying the changes in lipid transporters upon fasting. *** false discovery rate < 0.05 and log2(fold change) > 1.5. ### (false discovery rate) < 0.05, but log2(fold change) < 1.5. (G) Maximum-intensity projections of 6 dpf fasting Tg(fabp10a:GFP) (pink) with Nile Red staining (yellow) treated with 5 μM of lipofermata or 0.01% of DMSO (vehicle) from 4 to 6 dpf fast. Scale bar = 20 μm. (H, I) Barplot with the mean ± SEM of the number of lipid droplets per liver (H) and liver size (I) in vehicle- and lipofermata-treated animals. Each point represents a single animal. ns, not significant, ***P < 0.001, t test.
|