IMAGE

Figure 2.

ID
ZDB-IMAGE-240315-95
Source
Figures for Pozo-Morales et al., 2024
Image
Figure Caption

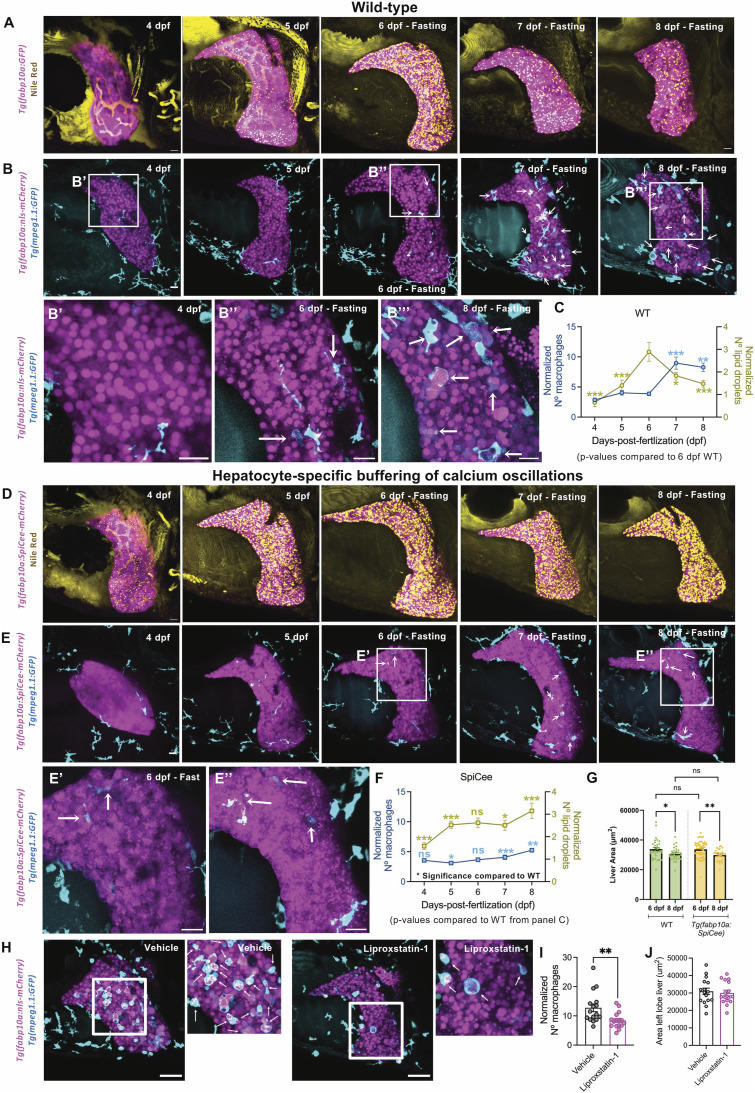
Figure 2. Reduction in the size of liver upon accumulation of lipid droplets during starvation.

(A) Maximum-intensity projections (MIP) of Tg(fabp10a:GFP) (referred to as WT) stained with Nile Red. Hepatocytes are false-colored in pink and lipid droplets in yellow. A timeline from 4 to 8 dpf of zebrafish larvae without exogenous food is presented. (B) Representative MIP images of timeline from Tg(fabp10a:nls-mCherry); Tg(mpeg1.1:EGFP) zebrafish from 4 to 8 dpf under the fasting condition. Arrows label macrophages with hepatocyte debris. A zoom of boxed regions is presented below the images. (C) Line trace representing lipid droplets and macrophages normalized to the liver area from 4 to 8 dpf. Comparisons with 6 dpf are represented. P-values: * < 0.05; ** < 0.01, and *** < 0.001, ANOVA test followed by the post hoc Tukey test. (D) MIP of Nile Red staining of Tg(fabp10a:SpiCee-mCherry), with hepatocytes false-colored in pink and lipid droplets in yellow. Representative images from 4 to 8 dpf fasting are presented. (E) Livers from 4 to 8 dpf from fasting Tg(fabp10a:SpiCee-mCherry); Tg(mpeg1.1:EGFP) are presented with MIP. Macrophages with hepatocyte debris are marked with arrows. A zoom of boxed regions is presented below the images. (F) Line trace representing lipid droplets and macrophages normalized to the liver area from 4 to 8 dpf in Tg(fabp10a:SpiCee-mCherry) animals. Comparisons with WT are shown. P-values: ns, not significant, * < 0.05, ** < 0.01, and *** < 0.001, t test or Mann–Whitney U test depending on the normality of the data. (G) Mean ± SEM of liver size in WT and Tg(fabp10a:SpiCee-mCherry) at 6 and 8 dpf without exogenous feeding. P-values: ns, not significant, * < 0.05, and ** < 0.01, t test. (H) Snapshots of livers at 8 dpf from Tg(fabp10a:nls-mCherry); Tg(mpeg1.1:GFP) fasting animals treated with 0.17% DMSO (vehicle) or 50 μM liproxstatin-1. Hepatocytes are false-colored in pink, and macrophages are false-colored in cyan. White arrows indicate macrophages with hepatocyte phagocytosis. (I) Mean ± SEM of the number of macrophages normalized by liver area in vehicle- and liproxstatin-1–treated animals. Each point represents a single animal. **P < 0.01, Mann–Whitney U test. (J) Mean ± SEM of the liver area in control and liproxstatin-1–treated animals at 8 dpf. Scale bar for all panels = 20 μm.

Acknowledgments
This image is the copyrighted work of the attributed author or publisher, and ZFIN has permission only to display this image to its users. Additional permissions should be obtained from the applicable author or publisher of the image. Full text @ Life Sci Alliance