FIGURE

Figure S4.

ID
ZDB-FIG-240315-100
Publication
Pozo-Morales et al., 2024 - Starvation-resistant cavefish reveal conserved mechanisms of starvation-induced hepatic lipotoxicity
Other Figures
All Figure Page
Back to All Figure Page
Figure S4.

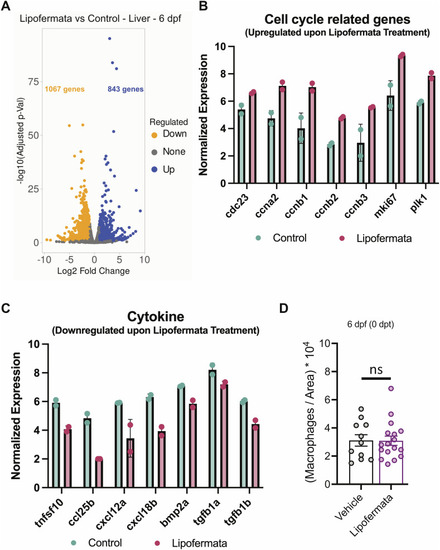
Transcriptional changes in the liver of 6 dpf fasting zebrafish upon lipofermata treatment.

(A) Volcano plot depicts the changes in gene expression in the liver of 6 dpf fasting zebrafish upon 48 h of lipofermata treatment. Up- and down-regulated genes are colored in blue and orange, respectively. (B, C) Barplot displaying the changes in selected cell cycle–related genes (B) and cytokines (C). All the plotted genes display gene expression differences with a false discovery rate < 0.1. (D) Mean ± SEM of the number of macrophages normalized by the liver area in vehicle- and lipofermata-treated animals at 6 dpf under fasting conditions. Each point represents a single animal. ns, P > 0.05, t test.

Expression Data

Expression Detail
Antibody Labeling
Phenotype Data

Phenotype Detail
Acknowledgments
This image is the copyrighted work of the attributed author or publisher, and ZFIN has permission only to display this image to its users. Additional permissions should be obtained from the applicable author or publisher of the image. Full text @ Life Sci Alliance