
Fig. 6
- ID
- ZDB-FIG-240301-18
- Publication
- Zhao et al., 2023 - Knockdown of Yap attenuates TAA-induced hepatic fibrosis by interaction with hedgehog signals
- Other Figures
- All Figure Page
- Back to All Figure Page
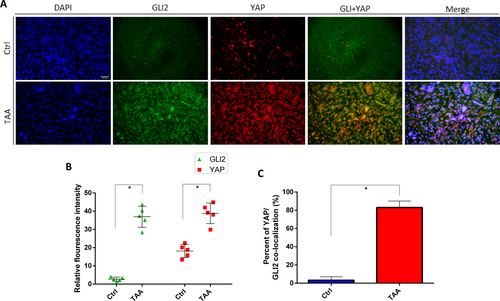
Immunohistochemical detection of the distribution of YAP and GLI2α in TAA-induced liver fibrosis. A Representative fluorescence microscopy of the distributions of YAP and GLI2α in liver sections using the indicated antibodies: anti-YAP (red), anti-GLI2α (green) and nuclei were stained with 4′, 6-diamidino-2-phenylindole DAPI (blue). The corresponding overlay of YAP and GLI2α is shown in panel (YAP + GLI2α) and the corresponding overlays of the three signals is shown in panel (merge). Scale bar = 50 µm. B Quantification of relative fluorescence intensity of YAP and GLI2α in control and TAA-induced liver fibrosis. C Percent of YAP/GLI2α nuclear colocalization in control and TAA-induced liver fibrosis. The fluorescence intensity of each section was measured by ImageJ. *p < 0.05, n = 5, means ± SD |