
Fig. 2
- ID
- ZDB-FIG-240301-14
- Publication
- Zhao et al., 2023 - Knockdown of Yap attenuates TAA-induced hepatic fibrosis by interaction with hedgehog signals
- Other Figures
- All Figure Page
- Back to All Figure Page
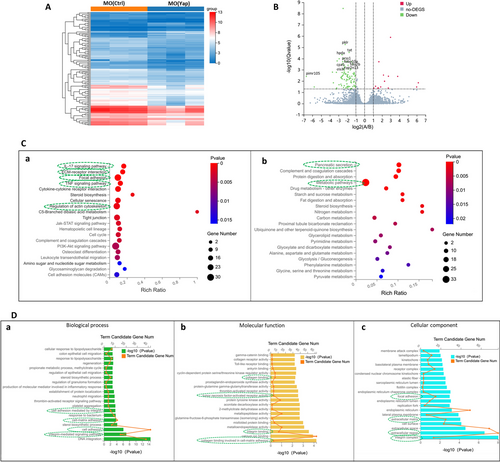
Global transcriptomic analysis and knockdown of Yap mediated signatures in zebrafish embryos. A Hierarchical clustering of RNA-Seq data shows global gene expression changes between the MO (Ctrl) and MO (Yap). High and low expression levels of genes are represented by red and blue. Gene expression (TPM) is log2-transformed and median-centered across genes. B Groups at mRNA level are shown in volcano plots of log2 (fold change) versus − log10 (p value). Red dots indicate up-regulated DEGs, the green dots indicate down-regulated DEGs, and blue dots represent non-DEGs. The top ten down-regulated transcripts, ranked by their distance to the base point are marked. C KEGG enrichment analysis of DEGs. Top 20 KEGG pathways among the down-regulated (a) or (b) up-regulated DEGs were presented in bar charts. D GO analysis of downregulated DEGs mediated by Yap knockdown. Top 20 GO in the three categories: biological process (a), molecular function (b) and cellular component (c) of significantly down-regulated DEGs were presented in bar charts |