IMAGE

Fig. 6

ID
ZDB-IMAGE-240229-141
Source
Figures for Kirchberger et al., 2024
Image
Figure Caption

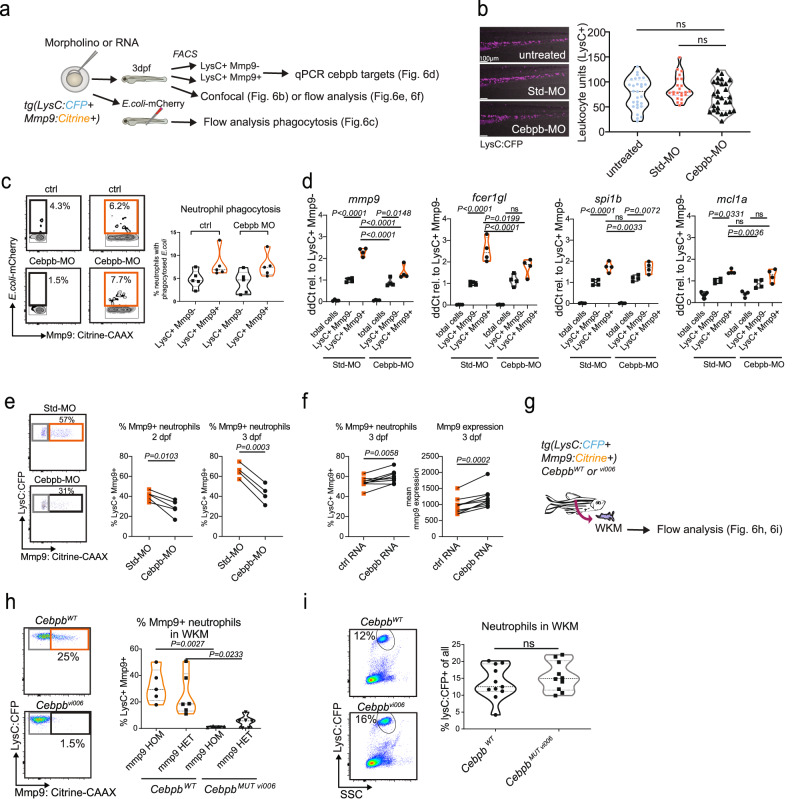
Fig. 6 Cebpb regulates aspects of late neutrophil maturation in zebrafish.

ae Analyses of standard (Std)-morpholino (MO) or cebpb-morpholino treated Tg(lysC:CFP-NTR)vi002/ Tg(BACmmp9:Citrine-CAAX)vi003 larvae at 3 dpf (days post-fertilization). a Schematic drawing of subsequent experiments. b ImageJ analysis of LysC+ leukocyte numbers in the tail region of untreated, control (ctrl) standard morpholino or cebpb morpholino-injected larvae (n = 28; 23; 28 larvae, respectively, one-way ANOVA with Tukey´s test, P = 0.1343, F = 2.041, representative image shown to the left). Leica SP8 confocal images with a HC PL APO CS 10x/0.40 DRY; Zoom 0.85x. c In vivo phagocytosis assay with E.coli-mCherry injected into the caudal vein after cebpb morpholino treatment. Representative flow cytometry plots (left). d qPCR of selected target genes of C/ebp-β (selected from Xie et al.14.) in FACS-sorted cells (n = 4; sorted from 65-102 larvae each; one-way ANOVA with Tukey´s test; all P < 0.0001, df = 18) after morpholino treatment at 3 dpf. ns = not significant. e Representative flow cytometry plots show reduction in LysC+Mmp9+ neutrophils after cebpb morpholino treatment (left). Plots summarizing four independent experiments each with pools of approx. 20 larvae per group analyzed by flow cytometry at 2 and 3 dpf after morpholino treatment (right). Two-tailed paired t test. f Frequencies of LysC+Mmp9+ neutrophils and mean mmp9:Citrine expression are increased after cebpb full-length RNA overexpression. Analyzed by flow cytometry 3 dpf after mRNA injection (n = 7; pools of 20 larvae each), two-tailed paired t test. gi Analyses of neutrophils from adult Cebpb mutant fish. WKM = whole kidney marrow. g Schematic drawing. WKM of adult Cebpb wildtype (cebpbWT) or Cebpb mutant (cebpbMUT vi006) Tg(lysC:CFP-NTR)vi002/ Tg(BACmmp9:Citrine-CAAX)vi003 fish was evaluated by flow cytometry. h Representative dot plots (left). Violin plot summarizing percentages of LysC+Mmp9+ neutrophils of all LysC+ neutrophils in mmp9:CitHOM (n = 5) mmp9:CitHET (n = 6) cebpbWT and mmp9:CitHOM (n = 4) mmp9:CitHET (n = 6) cebpbMUT vi006 kidneys. (One-way ANOVA with Tukey´s test P = 0.0006, F = 9.656, df = 17). i Representative dot plots (left). Violin plot summarizing percentages of LysC+ neutrophils of all live cells in cebpbWT (n = 11) and cebpbMUT vi006 (n = 10) kidneys (two-tailed unpaired t test; P = 0.3797).

Acknowledgments
This image is the copyrighted work of the attributed author or publisher, and ZFIN has permission only to display this image to its users. Additional permissions should be obtained from the applicable author or publisher of the image. Full text @ Nat. Commun.