IMAGE

Fig. 2

ID
ZDB-IMAGE-240229-137
Source
Figures for Kirchberger et al., 2024
Image
Figure Caption

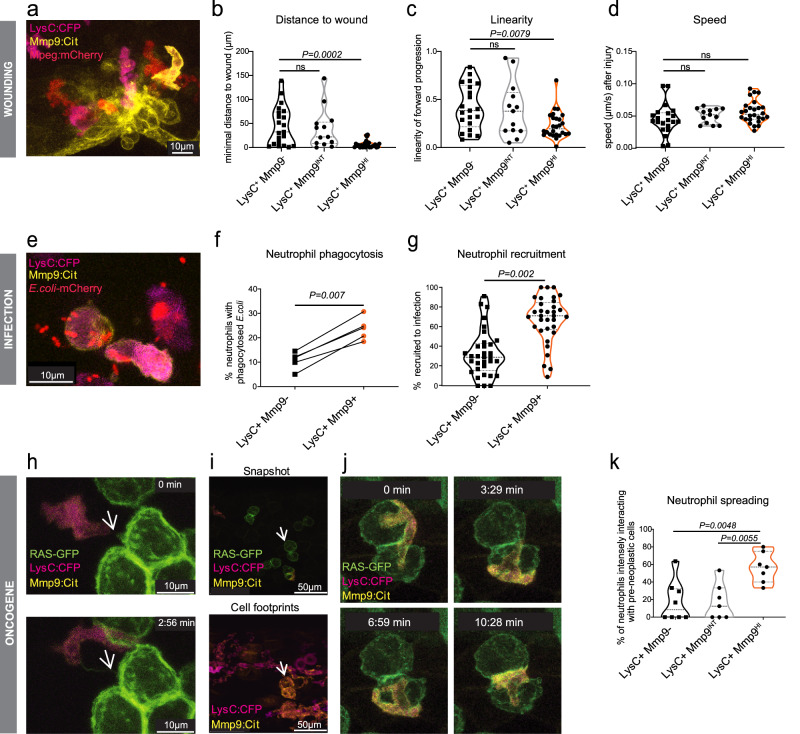
Fig. 2 Mmp9+ neutrophils show functions of mature neutrophils.

ad Recruitment of neutrophils to an injury of the fin at 2 dpf (days post fertilization) lysC:CFP+mmp9:CitrineHI, lysC:CFP+mmp9:CitrineINT and lysC:CFP+mmp9:Citrine- neutrophil tracks (n = 21; 13; 26 cells, df = 57, respectively; n = 6 larvae; One-way ANOVA with Dunnett’s test) were analyzed over a 2 h period: b for distance to a wound ROI (P = 0.0002, F = 9.955), (c) linearity of forward progression (mean straight line speed/ track mean speed) (P = 0.0086, F = 5.172) and (d) speed (P = 0.1315, F = 2.103). ns = not significant. INT = intermediate expression; HI = high expression. eg In vivo phagocytosis assays were performed by injecting mCherry-labeled E. coli into the caudal vein or otic vesicle of Tg(lysC:CFP-NTR)vi002/ Tg(BACmmp9:Citrine-CAAX)vi003 zebrafish larvae at 2 dpf. eE. coli were observed inside both, lysC:CFP+mmp9:Citrine+and lysC:CFP+mmp9:Citrine- neutrophils 6 hpi (hours post infection). f Phagocytosis experiments analyzed by flow cytometry (n = 5, each approx. 20 larvae; two-tailed paired t test, P = 0.007; df = 4); g Neutrophil recruitment to E.coli-mCherry injected into the otic vesicle of 3 dpf larvae was analyzed by confocal microscopy (n = 33, two-tailed paired t test, P = 0.002, df = 32). hk Neutrophil- pre-neoplastic cell interactions were observed by confocal microscopy in Et(kita:GAL4)hzm1/ Tg(UAS:EGFP-HRAS_G12V)io006/ Tg(lysC:CFP-NTR)vi002/ Tg(BACmmp9:Citrine-CAAX)vi003 zebrafish larvae starting at 78 hpf. h Still Images of z-stack maximum projections from a time-lapse movie showing Mmp9+ neutrophils forming dynamic contacts with GFP+ kita tumor cells. White arrows point at a GFP+ cell tether. Z-stacks were acquired every 88 s. i Snapshots and cell footprints were taken from the same time-lapse movie (t = 5 h). Superimposition of lysC:CFP and mmp9:Citrine from all time frames generating neutrophil footprints (bottom). White arrow points out how the movements of an Mmp9+ neutrophil copied the outline of the RAS-GFP+ cluster seen in the snapshot (top). j Close-up clippings showing an Mmp9+ neutrophil spreading over the pre-neoplastic cell cluster marked by a white arrow in (i). k Quantification of neutrophil-pre-neoplastic interactions were performed from maximum projections of different time-lapse movies. The frequency of interacting neutrophils of each subpopulation (no, intermediate or high mmp9:Citrine levels) getting into close, intense interactions with GFP+ kita/RAS skin pre-neoplastic cells. (n = 8, one-way ANOVA, P = 0.0022, F = 8.561, df = 19).

Acknowledgments
This image is the copyrighted work of the attributed author or publisher, and ZFIN has permission only to display this image to its users. Additional permissions should be obtained from the applicable author or publisher of the image. Full text @ Nat. Commun.