
Fig 4
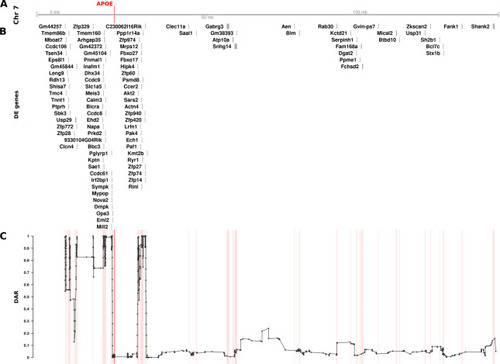
The relationship between DE genes and DAR along the entirety of mouse Chromosome 7 between male The plot contains four sets of information represented by separate tracks horizontally. Track A represents the axis of Chromosome 7. The position of the |