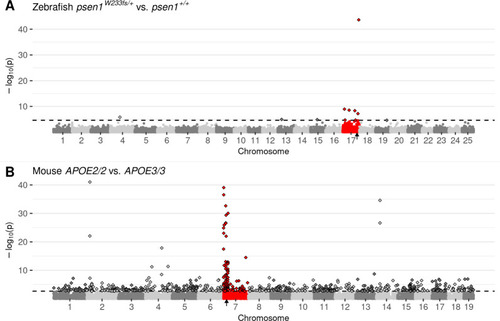
Manhattan plots highlighting CC-DEGs from differential expression testing in: A) Brain transcriptomes from a comparison of zebrafish psen1W233fs/+ vs. psen1+/+ siblings at 6 months of age. psen1W233fs is a dominant fAI-like frameshift allele. B) 3-month-old cerebral cortex transcriptomes from a comparison of homozygous male mice bearing humanised APOE2 or APOE3 alleles. Non-random accumulations of DEGs are supported by Bonferroni-adjusted Fisher’s exact test p-values for enrichment of DE genes on the mutant chromosome, A) psen1W233fs/+ vs. psen1+/+: p = 7.41e-7, B) APOE2/2 vs. APOE3/3: p = 2.03e-10. Genes are plotted along the x-axis based on their genomic positions along the chromosomes distinguished by alternating shades of grey. Genes on the chromosomes containing the mutations are highlighted in red. The approximate locations of the mutated genes are indicated with small black arrows on the x-axis. The raw p-values are plotted along the y-axis at the -log10 scale such that the most significant genes exist at the top of the plot. The cut-off for gene differential expression (FDR-adjusted p-value < 0.05) is indicated by a dashed horizontal line. Genes classified as differentially expressed under this criterion are represented as diamonds with a black outline.
|
