FIGURE

Fig 6

ID
ZDB-FIG-240226-113
Publication
Baer et al., 2024 - Differential allelic representation (DAR) identifies candidate eQTLs and improves transcriptome analysis
Other Figures
All Figure Page
Back to All Figure Page
Fig 6

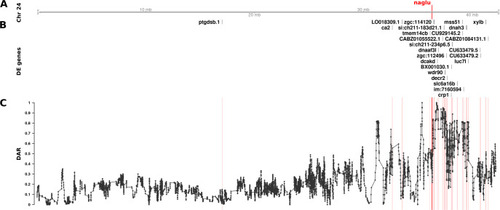
The relationship between DE genes and DAR along Chromosome 24 between nagluA603Efs/A603Efs and naglu+/+ 7 dpf larval zebrafish.

Track A represents the axis of Chromosome 24. The position of naglu is marked and labelled in bold red. Track B displays DE genes according to their positions along the chromosome. Track C shows the trend in DAR as a connected scatterplot with each point representing the DAR value at a single nucleotide variant position (elastic sliding window, n = 11 variants). Positions of the DE genes shown in track B are indicated by light red lines.

Expression Data

Expression Detail
Antibody Labeling
Phenotype Data

Phenotype Detail
Acknowledgments
This image is the copyrighted work of the attributed author or publisher, and ZFIN has permission only to display this image to its users. Additional permissions should be obtained from the applicable author or publisher of the image. Full text @ PLoS Comput. Biol.