|
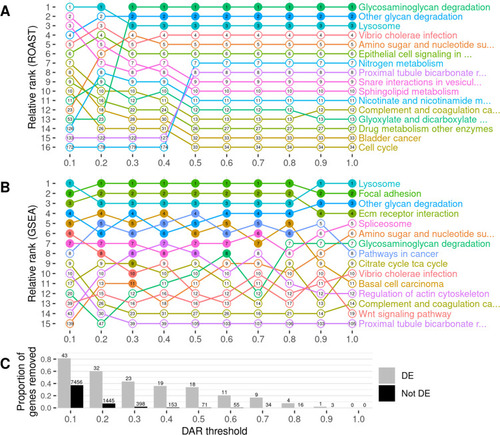
The impact of gene exclusion by DAR thresholding on the outcomes of functional enrichment analysis using KEGG gene sets. Panel A displays the outcomes of ROAST, while panel B displays the outcomes of GSEA. Gene sets are displayed only if they were found in the top ten most significant gene sets for at least one DAR threshold. The relative ranking between the displayed gene sets is represented along the y-axis for each threshold indicated on the x-axis. Filled dots indicate that the gene set was classified as significantly enriched (FDR-adjusted p-value < 0.05) at the respective threshold. The numbers inside the dots show the overall ranking of the gene set among all 186 KEGG gene sets tested. Panel C displays the proportion of DE (grey) and non-DE (black) genes that were removed at each threshold. The number of genes this equates to is displayed above each bar of the chart.
|