
Figure 8
- ID
- ZDB-FIG-240113-44
- Publication
- Uribe-Arias et al., 2023 - Radial astrocyte synchronization modulates the visual system during behavioral-state transitions
- Other Figures
- All Figure Page
- Back to All Figure Page
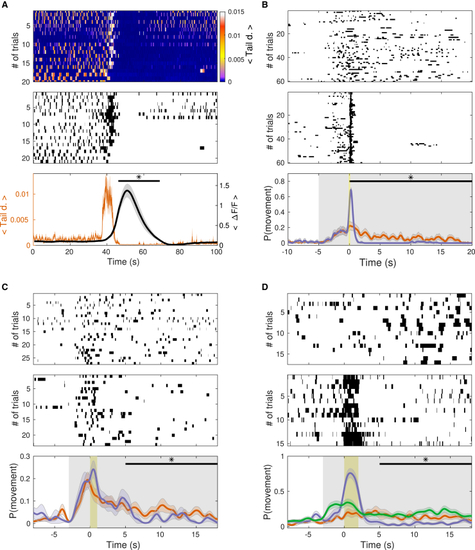
RA synchronization is associated with a decrease in spontaneous and visually induced motor behaviors (A)Top: a representative raster plot of tail deflection showing spontaneous tail movements. Color scale bar: tail deflection. Middle: a representative binary raster plot of the tails bouts on top. Bottom: orange, the averaged tail deflection across trials of spontaneous tail movements, aligned according to the maximal amplitude of RA synchronous Ca2+ events. Black, mean amplitude of the ΔF/F of RAs following an escape behavior. Note that the averaged tail deflection during the RA synchronous Ca2+ events was significantly smaller following the escape behaviors than before the escape behavior (mean tail deflection; during RA synchronization: 30-s period 0.19 × 10⁻³ ± 0.04 × 10⁻³. Before RA synchronization: 10-s period, 1.2 × 10⁻³ ± 0.58 × 10⁻³ [L0/R], p = 0.009, two-sided rank-sum test, n = 6 larvae). (B) Tail movements during the induction of RA synchronizations via a mild electric stimulus, while the larvae were engaged in OMR. Top: binary raster plot of tail bouts during control trials (no RA synchronization). Middle: raster plot of tail bouts in which a mild electric stimulus was presented. Bottom: the averaged probability of tail movements across trials without mild electric stimulus (top raster, orange) and with mild electric stimulation (middle raster, magenta). Shaded gray area: OMR, shaded yellow area: mild electric stimulus. Note that the probability of a tail bout after the mild stimulus was significantly lower than in control trials (20-s window starting 1 s after the mild electric stimulus, P[movement|mild electric stimulus] = 0.004 ± 0.014, P[movement|control] = 0.06 ± 0.05, p = 0.001, two-sided rank-sum test, n = 6 larvae). (C) As in (B), but RA synchronization was induced using optogenetic stimulation of LC (shaded yellow area). Note that the probability of a tail bout 5 s after the LC activation was significantly lower than that of control trials (10-s window starting 5 s after the LC activation, P[movement|LC activation] = 0.028 ± 0.022, P[movement|control] = 0.062 ± 0.032, p = 0.014, two-sided rank-sum test, n = 8 larvae). (D) As in (B), but RA synchronous Ca2+ events were induced by direct optogenetic stimulation of the RAs. Green curve: the averaged probability for wild-type larvae (not expressing ChR2, control). The probability of a tail bout 5 s after the RA activation was significantly lower than that of control trials (10-s window starting 5 s after the RA activation, P[movement|optogenetic stimulus] = 0.063 ± 0.07, P[movement|control] = 0.15 ± 0.07, p = 0.002, two-sided rank-sum test, n = 5 larvae. The optogenetic stimulation did not affect the behavior of wild-type larvae, P[movement|optogenetic stimulus] = 0.12 ± 0.1, P[movement|optogenetic control] = 0.16 ± 0.14, p = 0.36, two-sided rank-sum test, n = 8 larvae). |