
Figure 6
- ID
- ZDB-FIG-240113-42
- Publication
- Uribe-Arias et al., 2023 - Radial astrocyte synchronization modulates the visual system during behavioral-state transitions
- Other Figures
- All Figure Page
- Back to All Figure Page
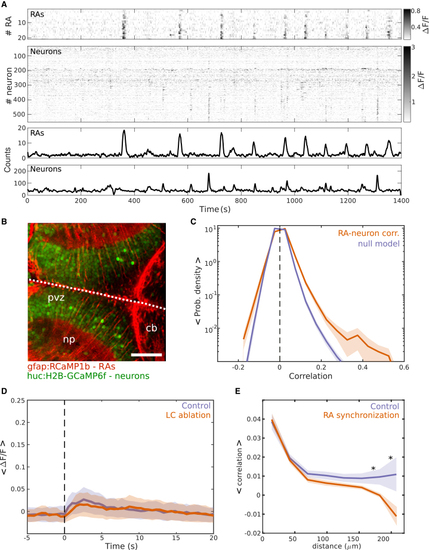
RA synchronous events modulate the functional correlations between tectal neurons (A) First: raster plot of the RAs’ spontaneous activity. Second: raster plot of the tectal neurons’ spontaneous activity; gray scale bar: ΔF/F. Third: number of active RAs. Fourth: number of active neurons. (B) Optical section of the optic tectum of a zebrafish larva expressing GCaMP under a neuronal promoter (HuC:GCaMP6f, green) and RCaMP1b under the control of a glial promoter (gfap:RCaMP, red). White dashed line: brain’s midline. cb, cerebellum; np, neuropil; prv, periventricular zone. Scale bars: 80 μm. (C) Probability density distribution of the mean pairwise correlations between RAs and neurons in the optic tectum (orange) and its respective null model (magenta), (RAs-neurons: 0.01 ± 4 × 10⁻³; null model, 4 × 10⁻³ ± 3 × 10⁻³, p = 0.053; two-sided rank-sum test, n = 7 larvae. (D) Mean ΔF/F of tectal neurons following an escape behavior (time zero). Orange: following LC ablation. Magenta: control conditions. Mean amplitude of two distributions were not significantly different (control: 0.079 ± 0.03; LC ablation: 0.070 ± 0.02 ΔF/F; p = 0.77, two-sided rank-sum test, n = 4 larvae). (E) The relationship between the mean pairwise correlations between the spontaneous activity of tectal neurons and their physical distance (magenta, control) and during induced RA synchronization. Note that RA synchronization is associated with a decrease in the pairwise correlations between distant neurons (182 μm, spontaneous activity: 6.8 × 10⁻³ ± 4.10 × 10⁻³; RA synchronization: 0.9 × 10⁻³ ± 1.2 × 10⁻³; p = 0.03. 208 μm, spontaneous activity: 1.8 × 10⁻³ ± 9 × 10⁻³ ± 8.7 × 10⁻³. RA synchronization: −6.6 × 10⁻³ ± 4.9 × 10⁻³; p = 0.049, two-sided rank-sum test, n = 7 larvae, Kolmogorov-Smirnov test was applied to evaluate if the distributions are different, p = 0.0054). Scale bars: 50 μm. See also |