
Figure 7
- ID
- ZDB-FIG-240113-43
- Publication
- Uribe-Arias et al., 2023 - Radial astrocyte synchronization modulates the visual system during behavioral-state transitions
- Other Figures
- All Figure Page
- Back to All Figure Page
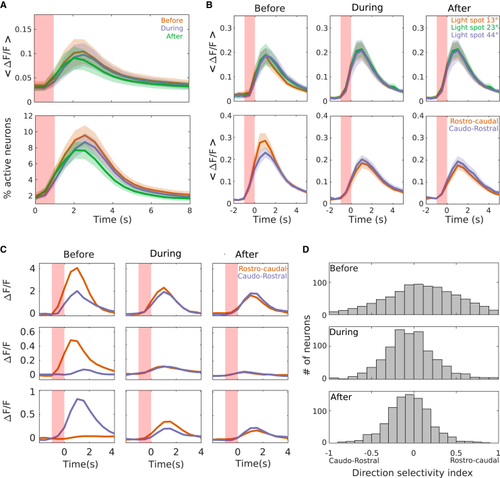
RA synchronization modulates the directional selectivity of tectal neurons (A) Top: mean ΔF/F of tectal neuron responses to visual stimulation before (orange), during (magenta), and after (green) RA synchronization events. Bottom: as on top but for the percentage of responsive neurons. Shaded red area: time of the visual stimulus. The three curves do not show any significant difference (top: before, 0.89 ± 0.27; during, 0.82 ± 0.23; after, 0.78 ± 0.24 ΔF/F.s; p = 0.46, Kruskal-Wallis test and multiple comparison test. Bottom: before, 9.12 ± 1.32; during, 8.23 ± 0.984; after, 7.33 ± 1.06 ΔF/F.s; p = 0.39, Kruskal-Wallis test and multiple comparison test). (B) Top: mean ΔF/F of tectal neuron responses to visual stimuli consisting of light spots of 13° (orange), 23° (green), and 44° (magenta) (light spots of 13°; before: 0.67 ± 0.14; during: 0.81 ± 0.16; after: 0.78 ± 0.17 ΔF/F.s; p = 0.70. Light spots of 23°; before: 0.65 ± 0.18; during: 0.81 ± 0.13; after: 0.69 ± 0.13 ΔF/F.s; p = 0.43. Light spots of 44°; before: 0.64 ± 0.16; during: 0.77 ± 0.16; after: 0.67 ± 0.16 ΔF/F.s; p = 0.85. Kruskal-Wallis test and multiple comparison test). Bottom: as on top for light bars moving in a rostro-caudal (orange) or caudo-rostral (magenta) direction (rostro-caudal: before, 1.54 ± 0.42; during, 0.99 ± 0.32; after, 0.90 ± 0.25 ΔF/F.s; p = 0.03. Caudo-rostral, before, 1.47 ± 0.35; during, 1.10 ± 0.25; after, 0.94 ± 0.29 ΔF/F.s; p = 0.13, Kruskal-Wallis test and multiple comparison test). (C) Three examples of the ΔF/F of individual neuron responses to light bars moving in the rostro-caudal (orange) and the caudo-rostral (magenta) direction, during and after the induction of RA synchronization. Note the reduction of the response to a specific direction during and right after the RA synchronization event. (D) Distributions of the direction selectivity of tectal neurons before (top), during (middle), and after (bottom) the induction of RA synchronization events. Note that high direction-selective values are reduced during and right after RA synchronizations (Kolmogorov-Smirnov test; before-during: p = 6.8 × 10⁻³; before-after: p = 3.6 × 10⁻³; during-after: p = 0.98; before, −10 s, during, 10.5 s, and after, 20 s, the RA synchronous event). See also |