
Figure 1
- ID
- ZDB-FIG-240113-37
- Publication
- Uribe-Arias et al., 2023 - Radial astrocyte synchronization modulates the visual system during behavioral-state transitions
- Other Figures
- All Figure Page
- Back to All Figure Page
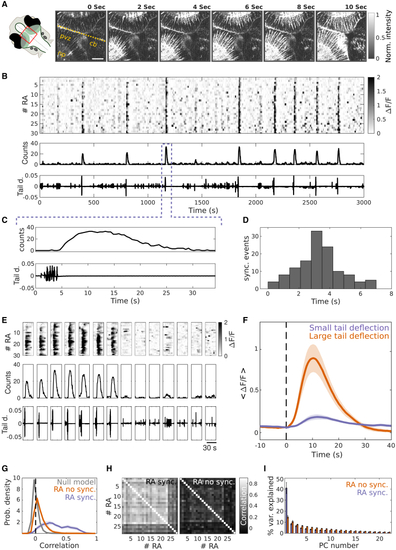
Tectal RAs synchronize their Ca2+ transients following an escape behavior (A) Left: scheme of the zebrafish head showing the imaged area (red square). Shaded green: optic tectum. Right: a temporal series of an optical section of the optic tectum of a zebrafish larva expressing GCaMP in RAs, imaged using a two-photon microscope (red square on the left). Note the changes in fluorescence of the RAs. Time zero indicates the onset of an escape behavior. Yellow dashed line, brain’s midline; cb, cerebellum; np, neuropil; pvz, periventricular zone. Gray scale bar: normalized florescence. Scale bars: 80 μm. (B) Top: raster plot of RAs’ spontaneous activity. Gray scale bar: ΔF/F. Middle: number of active RAs. Bottom: tail deflection (L0/R). Note the synchronous spontaneous Ca2+ events across all RAs. L0, length of the fish at rest; R, distance to the center of the tail curvature. (C) Zoom of the area in (B), indicated by the magenta dashed lines. (D) Histogram of the delay between the onset of the spontaneous escape behaviors and the onset of RA synchronous Ca2+ events (mean: 3.13 ± 0.6 s). (E) Top: raster plots of RA activity around 14 representative spontaneous tail movements. Gray scale bar: ΔF/F. Middle: number of active RAs. Bottom: tail deflection (L0/R). The first seven sub-panels show escape behaviors; the seven last sub-panels display low-deflection swimming bouts. (F) Mean amplitude of RA Ca2+ transients following a spontaneous tail movement (dashed line, time zero) for large-deflection (orange) and low-deflection (magenta) tail movements (large deflection, 0.98 ± 0.16; low-deflection, 0.24 ± 0.03 ΔF/F, p = 2.2 × 10⁻⁴; two-sided rank-sum test; n = 11 larvae). (G) Average probability density distribution of RA pairwise correlations (magenta), pairwise correlation of RAs without taking into account the synchronous events (orange), and the corresponding null model (gray) (mean correlations, RAs: 0.38 ± 0.04; RAs without synchronous events: 0.07 ± 0.01; null model: 4.3 × 10⁻⁴ ± 7.8 × 10⁻⁴; p = > 0.001, ANOVA and multiple comparison test; n = 11). (H) Left: example of a pairwise-correlation matrix between the Ca2+ transients of RAs. Note that RAs form a single main cluster. Right: example of a pairwise-correlation matrix between the Ca2+ transients of RAs without synchronous events, color scale bar: correlation value. (I) The eigenvector values of the different principal components (PCs), RA with synchronous events (magenta), RA without synchronous events (orange). Note that most of the variance can be explained by a single component only when RA synchronizations are taken into account, suggesting that the synchronous events involve all RAs (RA synch, PC1: 41.08% ± 4.97%; RA spont, PC1: 14.78% ± 1.27%). See also |