
Figure 5
- ID
- ZDB-FIG-240113-41
- Publication
- Uribe-Arias et al., 2023 - Radial astrocyte synchronization modulates the visual system during behavioral-state transitions
- Other Figures
- All Figure Page
- Back to All Figure Page
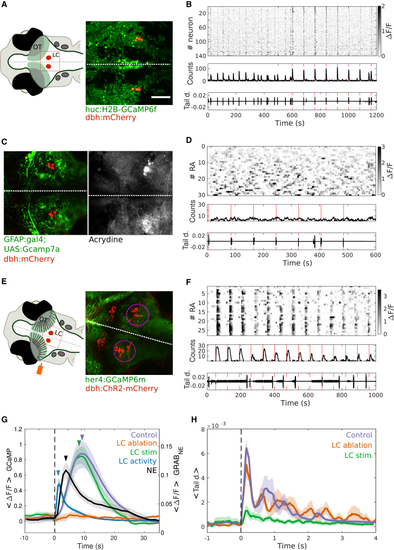
The tectal RAs’ synchronization is mediated by the locus coeruleus (A) Left: scheme of the head of a zebrafish larva. Red circles: locus coeruleus (LC), shaded green: optic tectum. Red square: area imaged on the right. Right: optical section containing the LC (red neurons). Green: neurons expressing GCaMP. Red: neurons expressing mCherry under an LC-specific promoter (dbh). White dashed line: brain’s midline. Scale bars: 80 μm. (B) Top: raster plot of the LC activity during periods of spontaneous activity and mild electric stimuli. Gray scale bar: ΔF/F. Middle: number of active LC neurons. Bottom: tail deflection (L0/R). Red line: time of mild electric stimuli. (C) Left: optical section containing the LC (neurons in red) before laser ablation. Green: RAs expressing GCaMP7. Red: neurons expressing mCherry under an LC-specific promoter (dbh). Right: staining of the same optical section after ablation with acridine orange to label apoptotic cells. Dashed line: brain’s midline. (D) Top: raster plot of the activity of RAs in the optic tectum following LC ablation, while presenting mild electric stimuli. Gray scale bar: ΔF/F. Middle: number of active LC neurons. Bottom: tail deflection (L0/R). Red line: time of mild electric stimuli. Note the absence of RA synchronization. (E) Left: scheme of the head of the zebrafish larva. Red circles: LC, shaded green: optic tectum. Red square: area imaged on the right. Blue: position of the beam of light used for optogenetic stimulation (100 μm fiber optic). Right: optical section containing the LC neurons expressing ChR-2 (red). Green: RAs expressing GCaMP. Red: neurons expressing ChR2-mCherry under an LC promoter (dbh). White dashed line: brain’s midline. Magenta dashed circle: LC area. (F) Top: raster plot of the activity of RAs in the optic tectum following LC optogenetic stimulation. Gray scalebar: ΔF/F. Middle: number of active RAs. Bottom: tail deflection (L0/R). Red line: time of LC optogenetic stimulation. Note the RA synchronization following LC stimulation, and its absence of correlation with tail movements. (G) The mean ΔF/F of the Ca2+ transients of the RAs following an escape behavior (control, magenta, n = 10), after ablation of the LC (LC ablation, orange, n = 4), and after optogenetic stimulation of LC (LC stimulus, green, n = 7). Note that the gap in the green line represents the saturation of the photomultiplier tube (PMT) during the optogenetic stimulation. The mean ΔF/F of the Ca2+ transients in LC neurons following an escape behavior (LC activity, blue). The mean NE transients sensed by the RAs following a mild electric stimulus (NE, black). Note that the mean amplitude of ΔF/F of RAs in control and LC stimulation conditions were not significantly different. However, these were significantly different from LC ablation (control, 0.89 ± 0.17; LC stimulation, 0.88 ± 0.11; LC ablation, 0.12 ± 0.03, ΔF/F; p = 8.7 × 10⁻³; Kruskal-Wallis test and multiple comparison test). The colored arrowheads depict the peaks of the different curves. Note that LC neurons show the earliest transients, followed by the NE transients sensed by the RAs in the OT. The latest transients are those of the RAs during their synchronization events (LC neurons, 2.61 ± 0.50 s; NE in RA, 6.20 ± 0.44 s; RAs after LC optogenetic stimulation, 9.61 RAs ± 0.30 s; RAs after escape behavior, 10.70 ± 0.71 s; p < 0.001; Kruskal-Wallis test and multiple comparison test). (H) Mean absolute tail deflection aligned to the onset of the spontaneous tail movements (black dashed line). Magenta: control conditions; orange: after LC ablation; green: LC optogenetic stimulation. Note that the integral of the tail deflection was not significantly different between control and LC ablation conditions, but these were significantly different from the direct optogenetic stimulation of LC (control: 0.36 ± 0.05; LC ablation: 0.39 ± 0.09; LC stimulation: 0.08 ± 0.05 L0.s/R; p = 0.01; Kruskal-Wallis test and multiple comparison test). Scale bars: 80 μm. Dashed line: onset of induced escape behavior. See also |