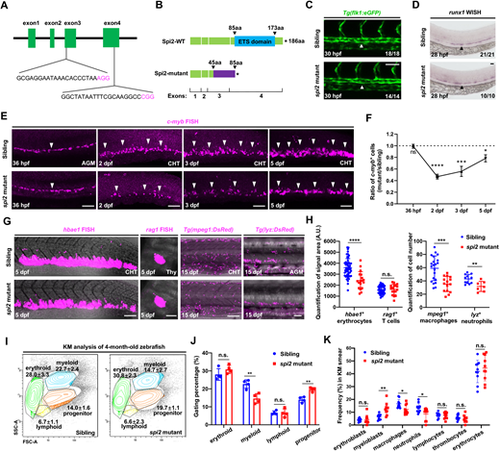
View largeDownload slide spi2 mutants are defective in HSPC maintenance in the CHT and myeloid cells in adulthood. (A) sgRNA design for generating spi2 mutants. (B) The spi2 mutation leads to a 546 bp deletion of the genomic sequences, resulting in generation of a truncated Spi2 protein lacking the ETS domain. (C) Images of flk1-eGFP expression indicating normal dorsal aorta (DA) formation in spi2 mutants. White arrowheads show the vascular structure of the dorsal aorta (DA). (D) runx1 WISH in spi2 mutants and siblings in the aorta-gonad-mesonephros (AGM) at 28 hpf. Black arrowheads show runx1-expressing cells. (E) c-myb FISH in the AGM at 36 hpf and the caudal hematopoietic tissue (CHT) at 2 dpf, 3 dpf and 5 dpf in spi2 mutants and siblings. White arrowheads show c-myb-expressing cells. (F) The ratio of c-myb+ cells (the numbers of c-myb+ cells in the mutants divided by the average number of c-myb+ cells in siblings). Number of siblings or spi2 mutants at 36 hpf, 2, 3 and 5 dpf: 47, 48, 23 and 20, or 18, 18, 10 and 13, respectively. (G,H) Images and quantification of hbae1 FISH, rag1 FISH, anti-mpeg1:DsRed+ staining and anti-lyz:DsRed+ staining in the AGM, CHT or thymus in spi2 mutants and siblings at 5 dpf or 15 dpf. Numbers of siblings or spi2 mutants: 55, 46, 21 and 11, or 18, 17, 15 and 7, respectively. (I,J) FACS analysis and quantification of the percentages of gated lineages in total singlet cells of whole KM in 5-month-old spi2 mutants and siblings (n=4 each). (K) MGG staining quantification of hematopoietic cell types in whole KM smear in 1-year-old spi2 mutants and siblings (n=3 each). Each dot indicates single captured image (n=10 each). n/N reports the number of embryos with staining pattern in image/total embryos. Data are mean±s.d. n.s., P>0.05; *P≤0.05; **P≤0.01; ***P≤0.001; ****P≤0.0001 (Unpaired Student’s t-test). A.U., arbitrary unit. Scale bars: 60 μm.
|
