
FIGURE
Figure 2.
- ID
- ZDB-FIG-231212-43
- Publication
- Singh et al., 2023 - NMJ analyser: a novel method to quantify neuromuscular junction morphology in zebrafish
- Other Figures
- All Figure Page
- Back to All Figure Page
Figure 2.
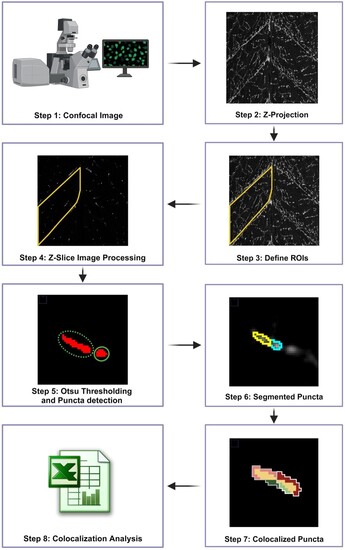
NMJ analysis workflow overview (Steps 1–7). Z-projection are created of the confocal images where users are prompted to define the ROIs. Each z-slice is processed for contrast enhancement and punctum detection via Otsu thresholding. Clustered puncta are segmented into single punctum and co-localization analysis is performed for each punctum in the defined ROI. |
Expression Data
Expression Detail
Antibody Labeling
Phenotype Data
Phenotype Detail
Acknowledgments
This image is the copyrighted work of the attributed author or publisher, and
ZFIN has permission only to display this image to its users.
Additional permissions should be obtained from the applicable author or publisher of the image.
Full text @ Bioinformatics