
Figure 8.
- ID
- ZDB-FIG-231212-49
- Publication
- Singh et al., 2023 - NMJ analyser: a novel method to quantify neuromuscular junction morphology in zebrafish
- Other Figures
- All Figure Page
- Back to All Figure Page
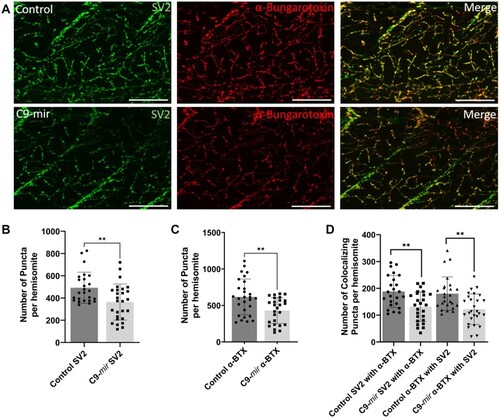
NMJ Morphology in Control versus C9-miR Zebrafish. (A) Co-immunostaining of zebrafish NMJs with presynaptic (SV2a; green) and postsynaptic (α-bungarotoxin; red) markers at 6 dpf. Scale bar = 100 µm. (B) Quantitative analysis demonstrated a significant decrease in the number of presynaptic (SV2a) puncta in C9-miR zebrafish (363.9 ± 161.7) compared to WT zebrafish (492.7 ± 139.2). (C) Quantitative analysis demonstrated a significant decrease in the number of postsynaptic (α-BTX) puncta in C9-miR zebrafish (430.0 ± 177.8) compared to WT zebrafish (616.9 ± 243.7). (D) Co-localization analysis revealed a significant decrease in the co-localization of presynaptic (SV2) puncta with postsynaptic (α-BTX) puncta in C9-miR zebrafish (131.7 ± 55.2) compared to WT zebrafish (188.4 ± 59.5). Similarly, co-localization analysis of postsynaptic (α-BTX) puncta with presynaptic (SV2) puncta revealed a marked reduction in co-localizing puncta in C9-miR zebrafish (122.1 ± 56.5) compared to WT zebrafish (180.3 ± 62.6). |
| Fish: | |
|---|---|
| Observed In: | |
| Stage: | Day 6 |