
FIGURE
Figure 6.
- ID
- ZDB-FIG-231212-47
- Publication
- Singh et al., 2023 - NMJ analyser: a novel method to quantify neuromuscular junction morphology in zebrafish
- Other Figures
- All Figure Page
- Back to All Figure Page
Figure 6.
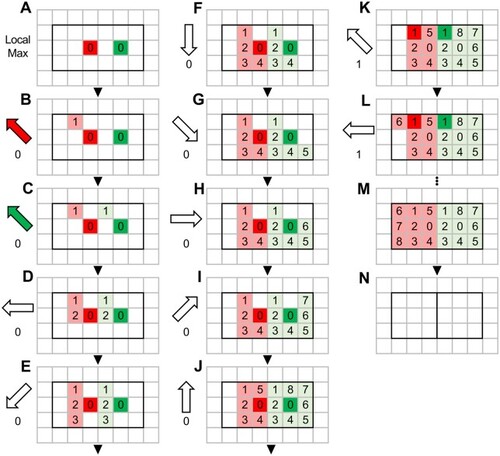
Expansion Algorithm. The expansion algorithm cycles through the eight neighboring pixels of each local maximum (A), beginning with top left (B and C), then cycling through each direction (D–J), assigning the neighboring pixel to a local maximum if the pixel is both unclaimed and within the punctum region. Once a cycle of eight directions has been completed, it is repeated with the first expansion as the origin of expansion (K). This process is repeated until the entire region of the punctum has been assigned to a local maximum (L–N). |
Expression Data
Expression Detail
Antibody Labeling
Phenotype Data
Phenotype Detail
Acknowledgments
This image is the copyrighted work of the attributed author or publisher, and
ZFIN has permission only to display this image to its users.
Additional permissions should be obtained from the applicable author or publisher of the image.
Full text @ Bioinformatics