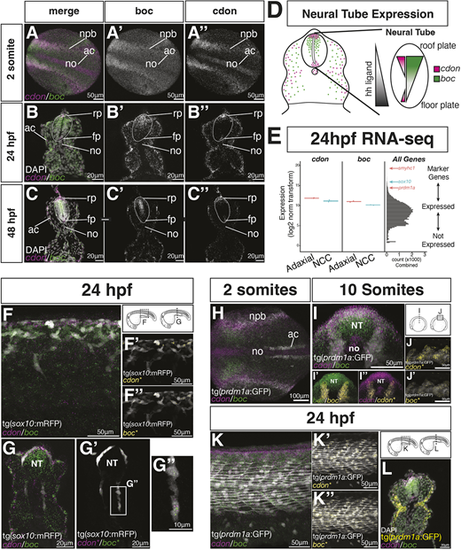
cdon and boc are expressed by NCCs and adaxial mesoderm cells. (A-C) Hybrid chain reaction in situ hybridization (HCR) shows cdon (magenta) and boc (green) expression in the developing neural tube of two somites shown in a dorsal view (A), and in 24 hpf (B) and 48 hpf (C) cross-sectioned embryos (20 µm sections at the level of the yolk extension). (D) Schematic of a cross-section at yolk extension summarizing cdon and boc expression in the neural tube. The gradient of hedgehog ligand is indicated in gray. (E) Bulk RNA-seq from two replicate samples of FAC-sorted tNCCs (blue) and slow-twitch muscle (red) suggest both tissues express cdon and boc. Right panel is a histogram of gene expression levels for all samples for all genes. Location of genes known to mark NCCs (blue) or slow-twitch muscle (red) are indicated. (F) Whole-mount lateral view of 24 hpf embryo showing expression of cdon and boc with NCCs (gray) labeled by the tg(sox10:mRFP) transgene at level of yolk extension. (F′,F″) HCR puncta overlapping the sox10 transgene (*) are shown in yellow. (G-G″) Cross-section shows tNCCs expressing cdon and boc transcripts. (H-L) HCR expression of cdon and boc in adaxial mesoderm labeled with the tg(prdm1a:eGFP) transgene (gray). (H) Dorsal view of a two-somite embryo. (I-J′) Optical cross-sections (I-I″) and lateral views (J,J′) of a 10-somite embryo. (I′,I″,J,J′) HCR puncta overlapping the tg(prdm1a:eGFP) transgene are shown in yellow. Only HCR puncta overlapping the tg(prdm1a:eGFP) transgene are shown in J and J′. (K) Lateral view of 24 hpf embryo showing cdon and boc transcripts in slow-twitch muscle. K′ and K″ show overlapping puncta labeled in yellow. (L) Cross-section of a 24 hpf embryo shows tg(prdm1a:eGFP) in yellow, cdon/boc puncta in slow-twitch muscle along with the nuclear marker DAPI in white. ac, adaxial cells; fp, floor plate; no, notochord; rp, roof plate.
|
